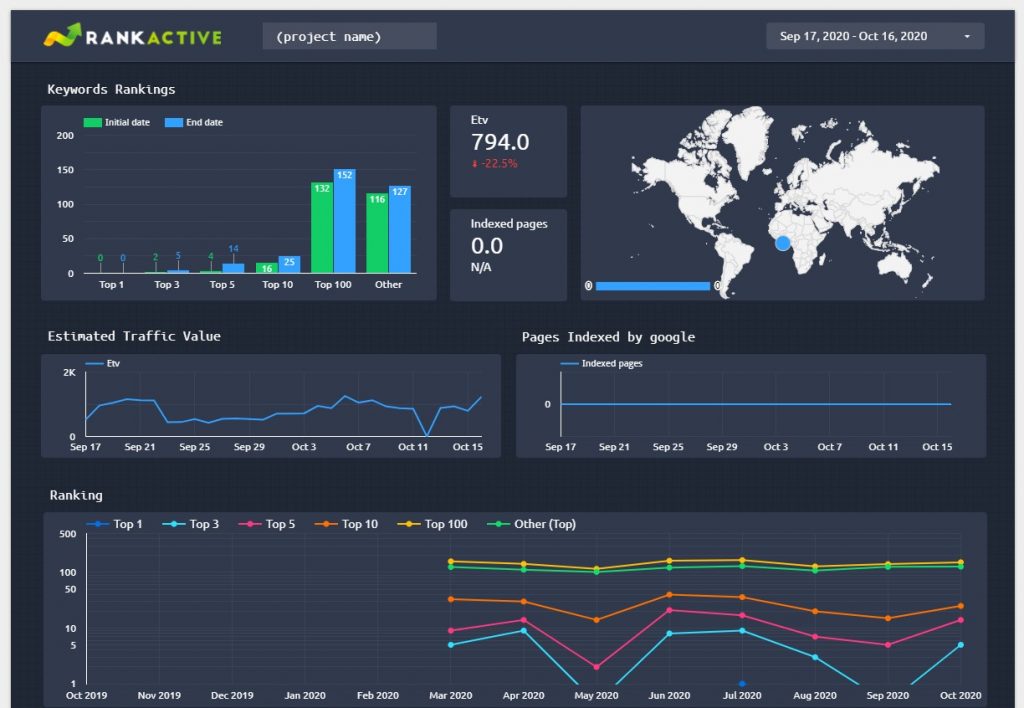
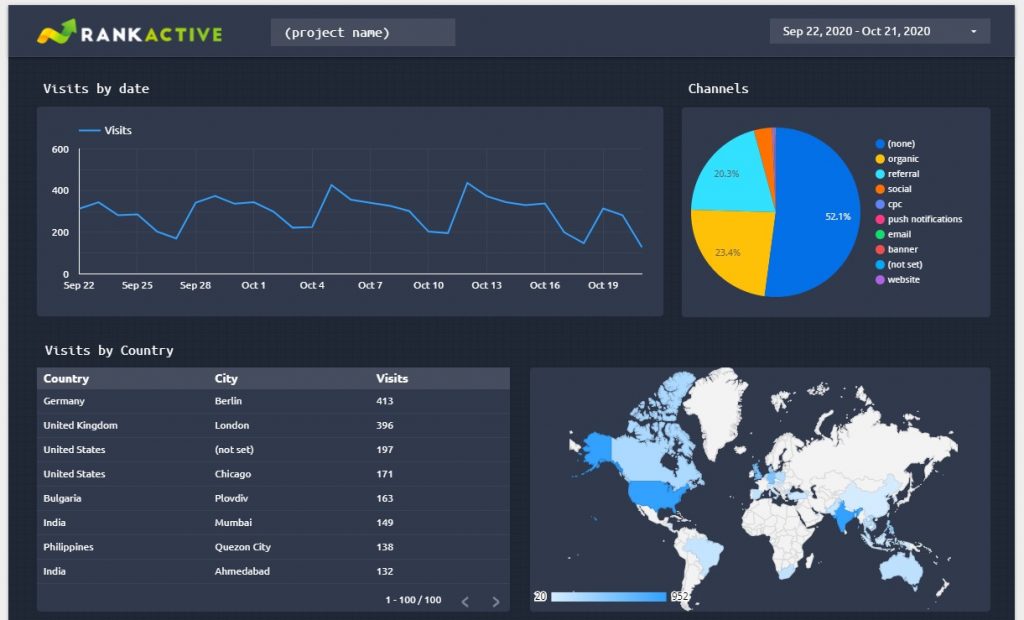
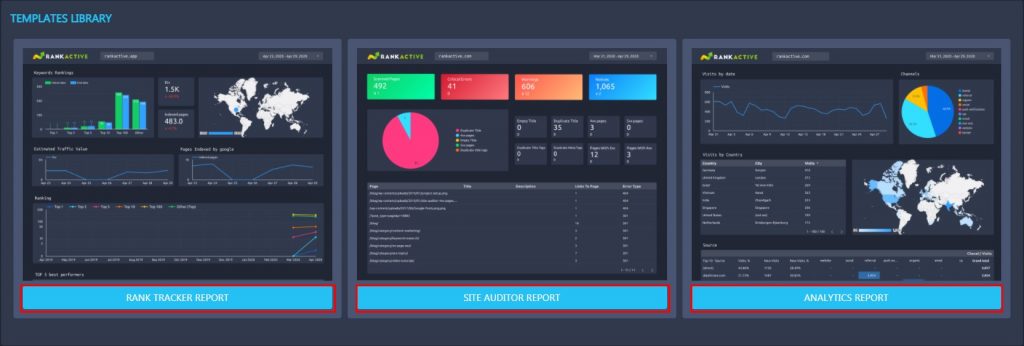
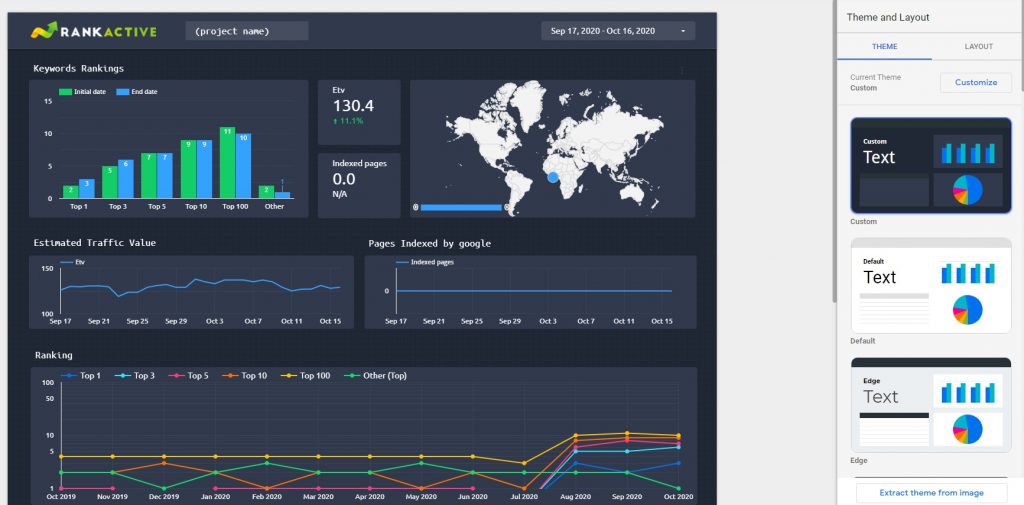
In the Reports section, you can create three customizable reports:
1. Rank Tracker Report will provide you with info on website rankings. It can show you how many keywords rank in Top 1, Top 3, Top 5, Top 10, and Top 100, how many indexed pages your site has, which keywords perform best, and what is the estimated traffic value of all project keywords.
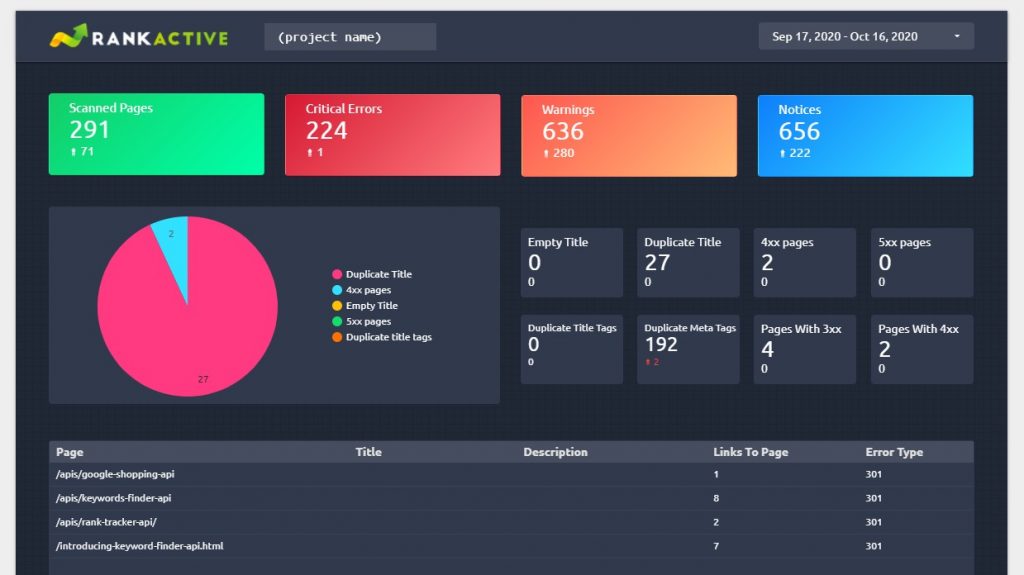
2. Site Auditor Report displays info on website performance. It can help you discover how many issues your site has, including 3xx. 4xx, and 5xx pages, duplicate titles, duplicate meta tags, and empty titles.
3. Analytics Report is designed to provide website traffic insights. It can help you understand what countries your visitors come from, what sources bring you the most traffic, and how many visits you have on each day of the month.
These reports are fully interactive, which means they show real-time data extracted from RankActive’s tools.
How to create a report
To create a report, choose one of the available templates.
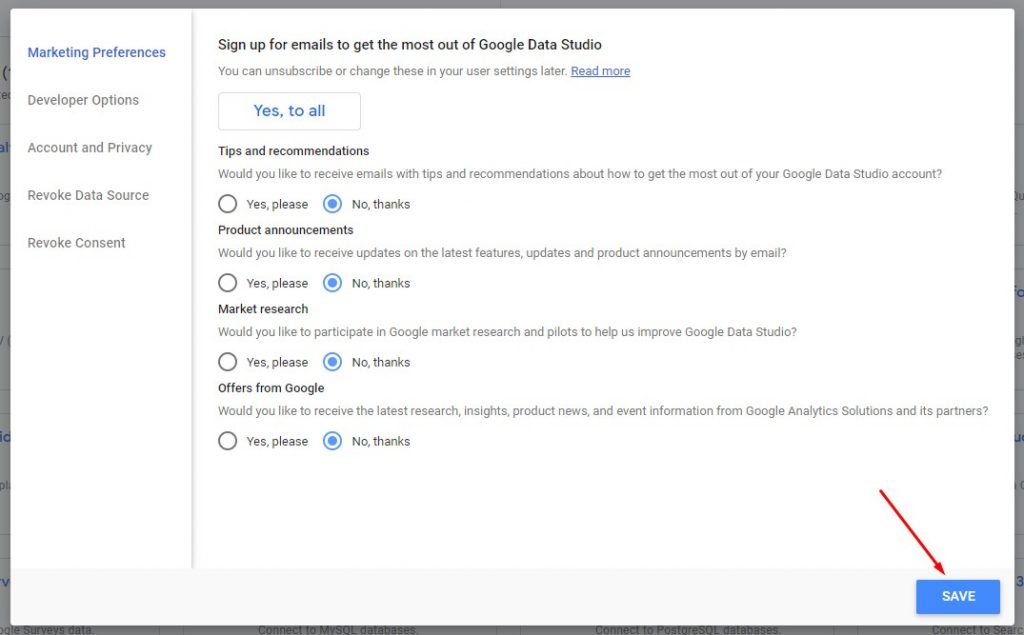
You will be redirected to Google Data Studio. Tick your marketing preferences and click Save.
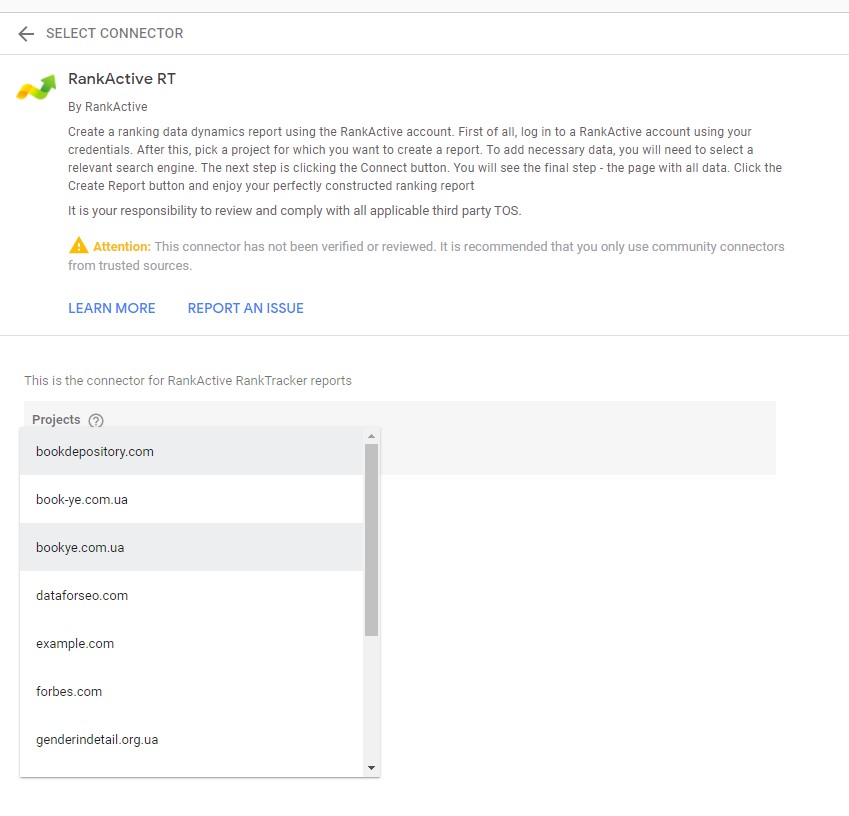
After that, choose the desired project from a dropdown list.
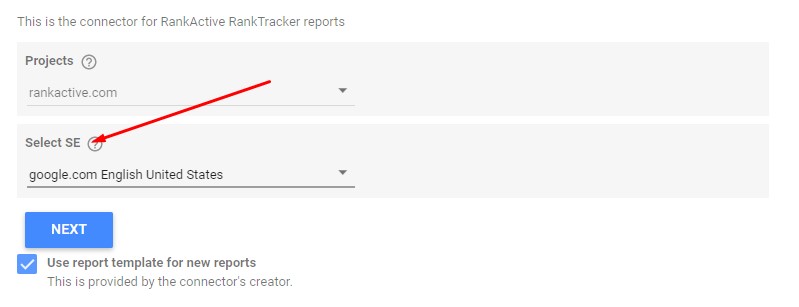
Ensure the Use report template for new reports option is turned on and click Next.
Select the desired search engine and click Next.
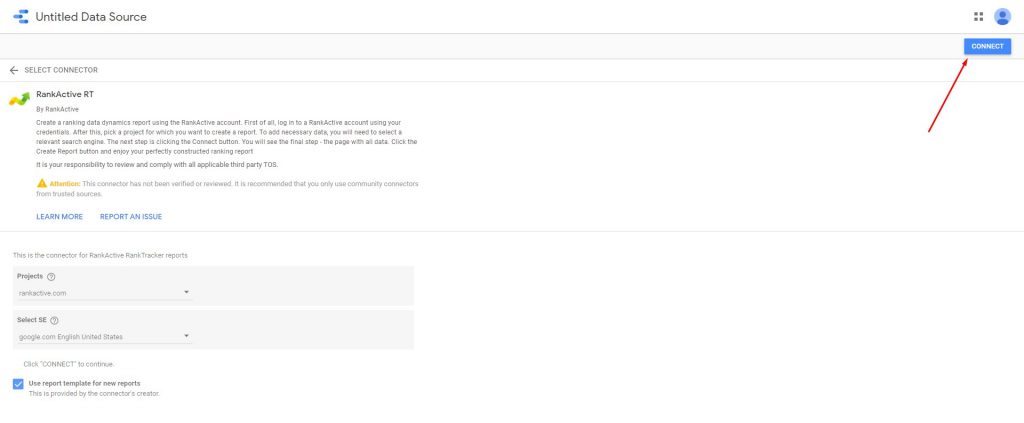
After that, click Connect in the upper right corner.
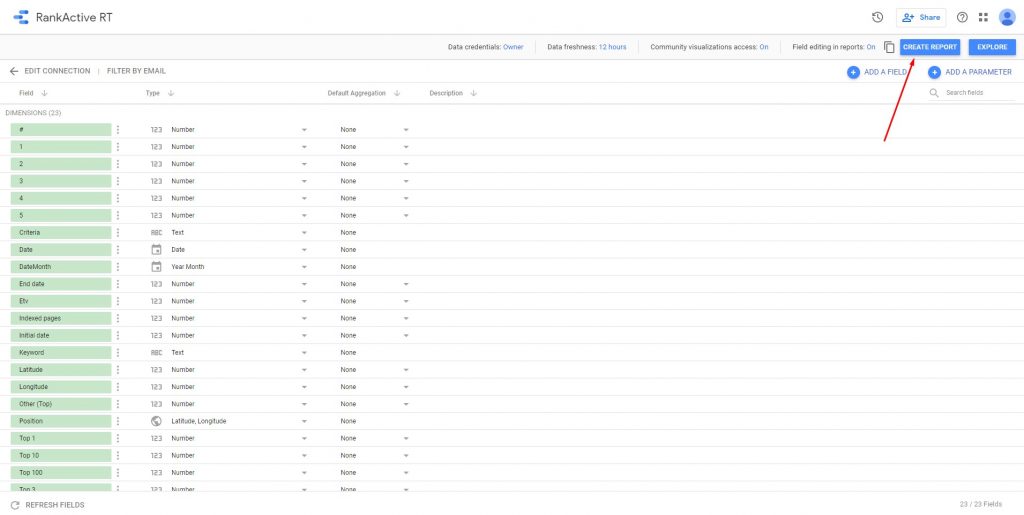
Then click Create report.
A new window will open. Click Create report again and wait a few seconds for it to load.
Now you can customize the report however you want. To learn more about the customization process, read this blog post.
How to share a report
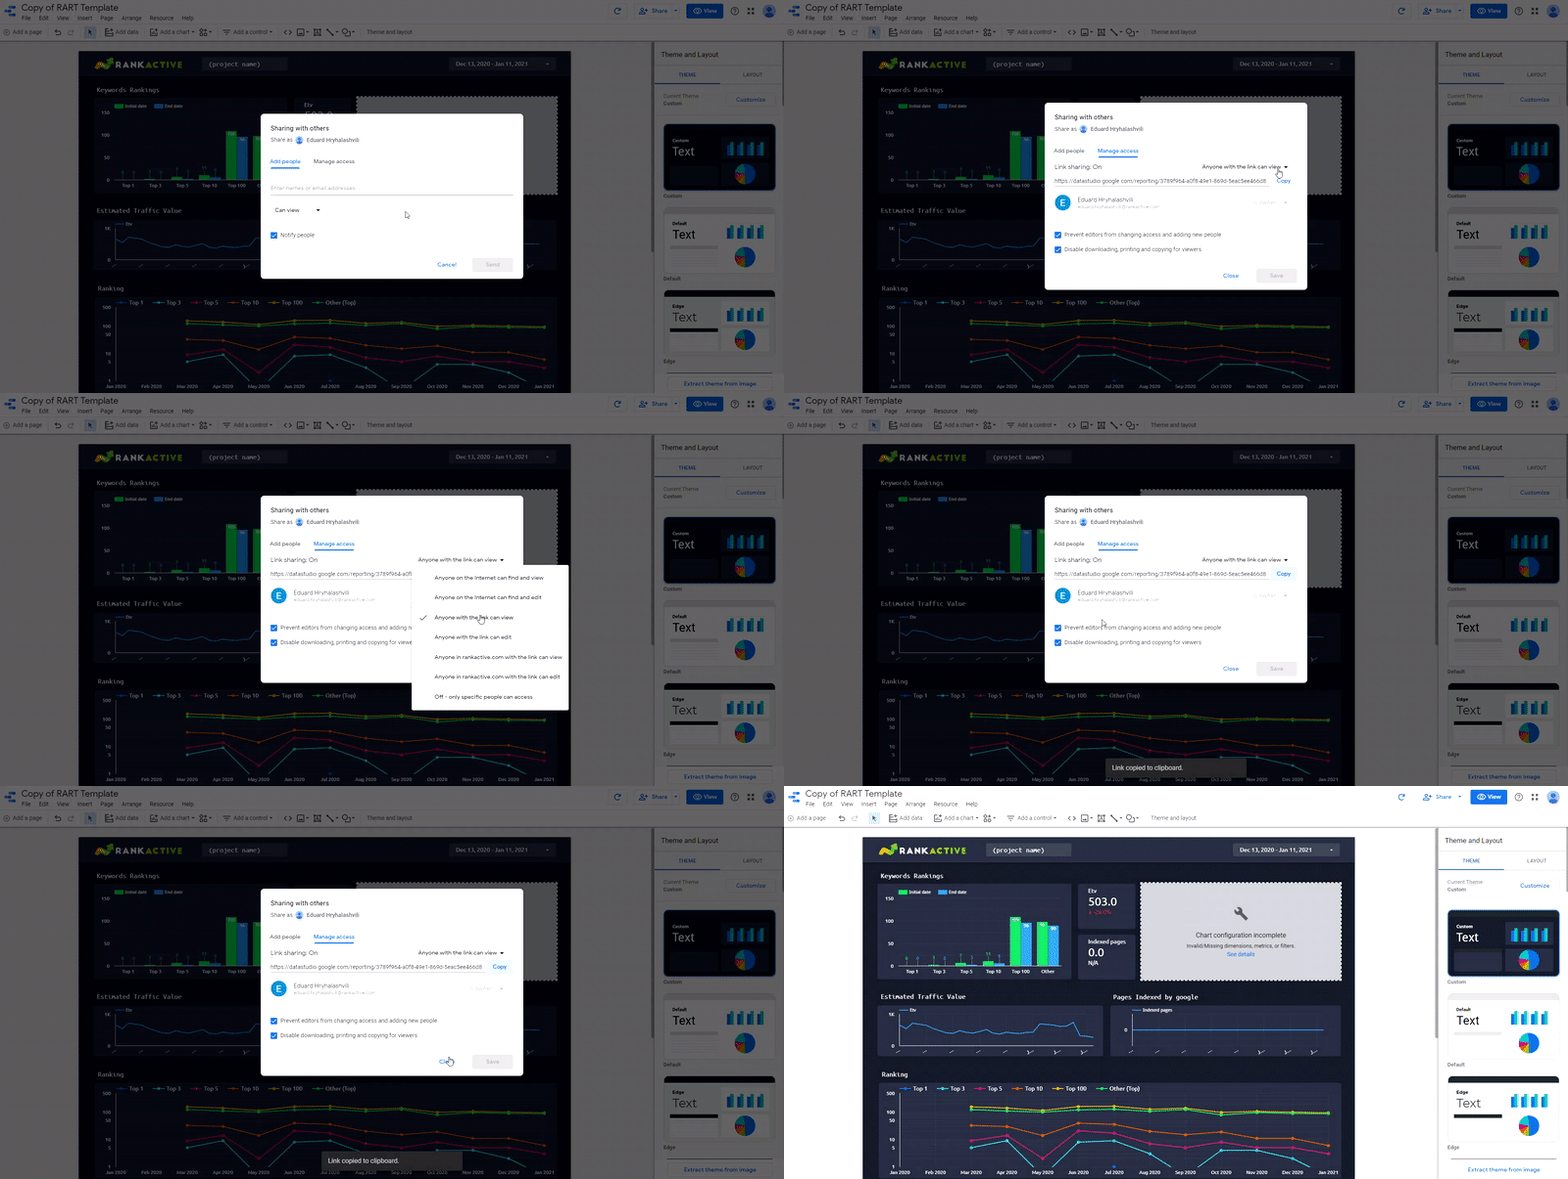
To share your report, click on the Share button in the upper right corner.
Now you can either add people manually by entering their email addresses or enable link sharing so that anyone with the link can access the report.
