The Lighthouse section provides complex information about website performance on desktop and mobile devices. It also includes essential SEO, Performance, Accessibility, and PWA metrics along with Best Practices on improving your website. The section is divided into two parts: Mobile and Desktop.
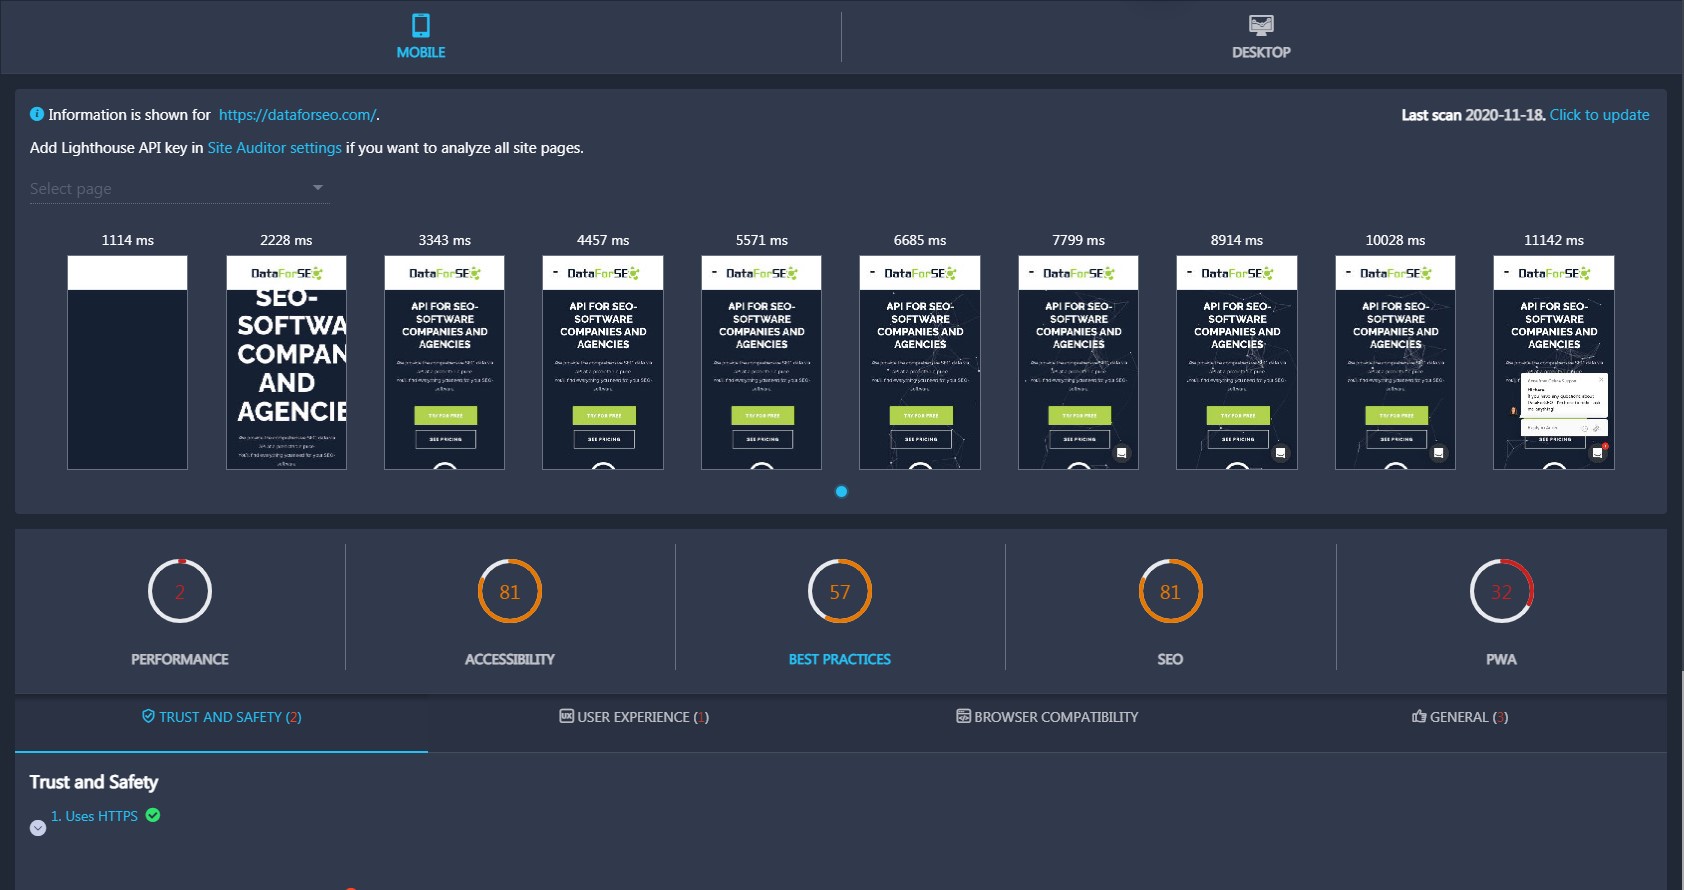
Mobile
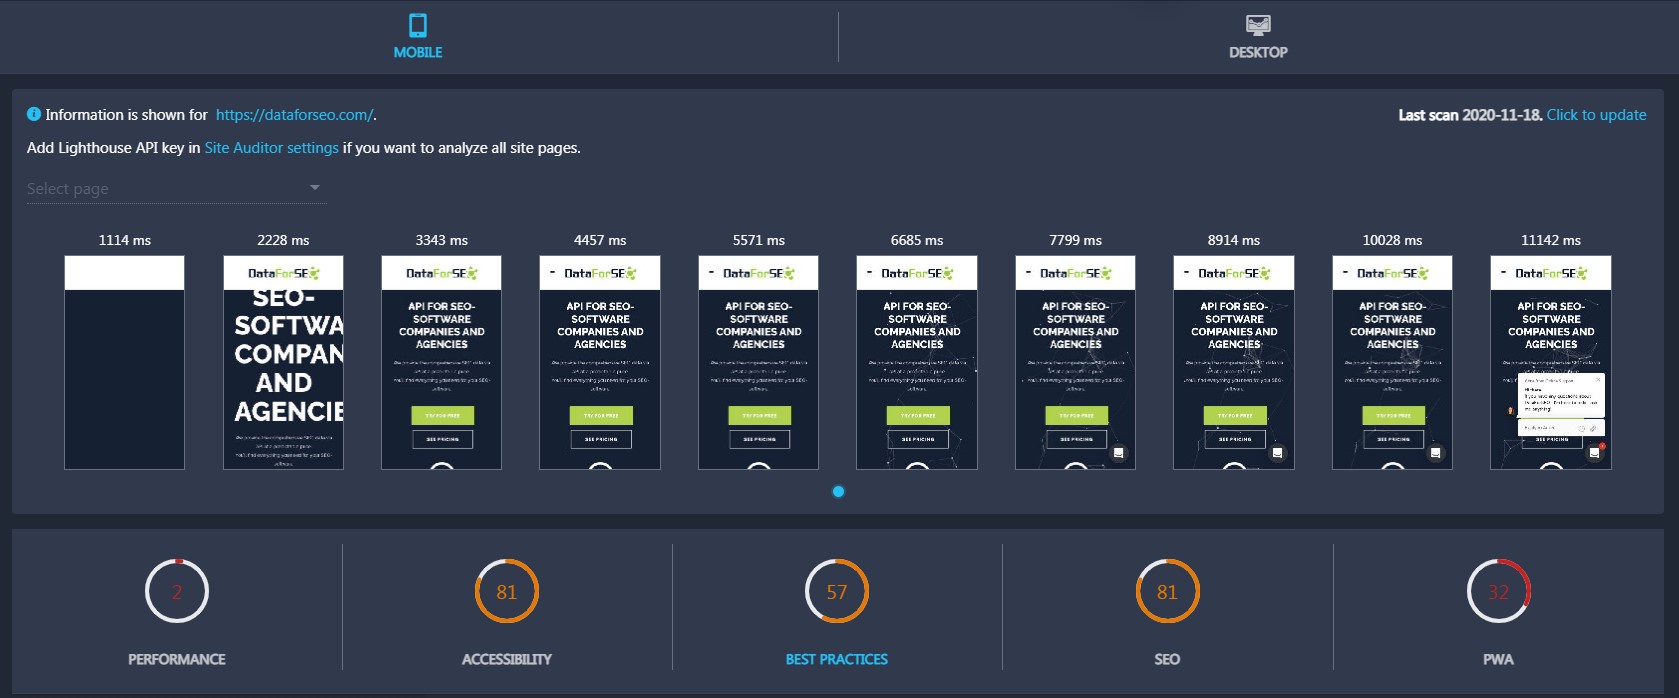
In the Mobile section, you can discover your website’s performance on mobile devices. By default, the tool scans only the homepage of your site but you can also select a particular page to be scanned in the Select page field. To do that, you have to generate an API key first:
- Go to Site Auditor, open Settings, and scroll the page down.
- Click on Get API key and go to the PageSpeed API page.
- Click on Get a Key, enter the project name in the opened window.
- Copy the generated API Key and click Done.
- Go back to the Settings and enter the API key into the Key field.
- Click Save and return to the Lighthouse section.
Now you can choose a particular page to be scanned by the Lighthouse tool. It will scan and score this page for various SEO parameters.
Performance section

In the Performance section, you can check your website’s performance score. It is divided into four parts: Metrics, Title, Opportunities, and Diagnostics.
In the Metrics part, you will find the following metrics: First Contentful Paint, Speed Index, Largest Contentful Paint, Time To Interactive, Total Blocking Time, and Cumulative Layout Shift.
- First Contentful Paint marks the time at which the first text or image is painted. Ideally, it should be painted within 0 – 2 seconds.
- Speed Index measures how quickly content is visually displayed during page load. Ideally, it should be displayed within 0 – 4,3 seconds.
- Largest Contentful Paint marks the time at which the largest text or image is painted. Ideally, it should be painted within 0 – 2,5 seconds.
- Time To Interactive displays the amount of time it takes for a page to become fully interactive. Ideally, a page should become fully interactive within 0 – 3,8 seconds.
- Total Blocking Time displays the sum of all time periods between FCP and Time to Interactive when task length exceeded 50ms, expressed in milliseconds. Ideally, it should be between 0 and 300 milliseconds.
- Cumulative Layout Shift measures the visual stability of page content. A layout shift occurs any time a visible element changes its position from one rendered frame to the next. To provide a good user experience, sites should strive to have a CLS score of less than 0.1.
In the Title part, you will find the following metrics: First CPU Idle, Max Potential First Input Delay, First Meaningful Paint, Estimated Input Latency, and First Contentful Paint (3G).
- First CPU Idle measures how much time it takes a page to become minimally interactive. A page is considered minimally interactive when most UI elements on the screen are interactive and a page responds, on average, to most user input in a reasonable amount of time. Ideally, a page should become minimally interactive within 0 – 4,7 seconds.
- Max Potential First Input Delay measures the worst-case First Input Delay that your users might experience. Ideally, Max Potential FID should be less than 130 milliseconds.
- First Meaningful Paint measures when the primary content of a page is visible to users. Ideally, it should be visible within 0 – 2 seconds.
- Estimated Input Latency is an estimate of how long your app takes to respond to user input during the busiest 5-second window of page load. Ideally, the latency should be less than 50 milliseconds.
- First Contentful Paint 3G marks the time at which the first text or image is painted while on a 3G network. Ideally, it should take from 0 to 2 seconds.
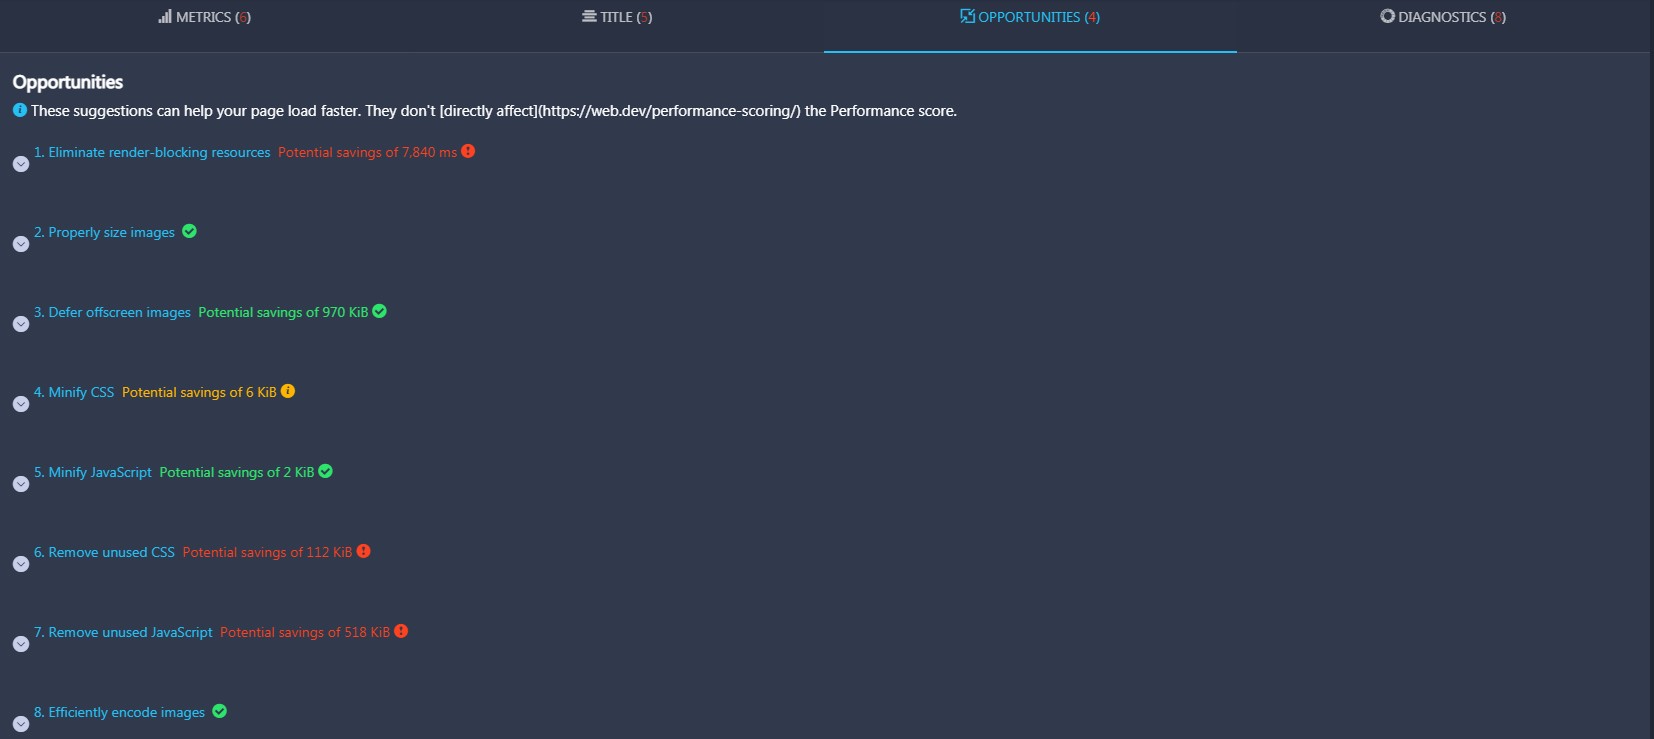
In the Opportunities part, you will find several suggestions that can help you make your website pages load faster. If some of suggestions are already implemented, they will be marked with green checkmark icons.
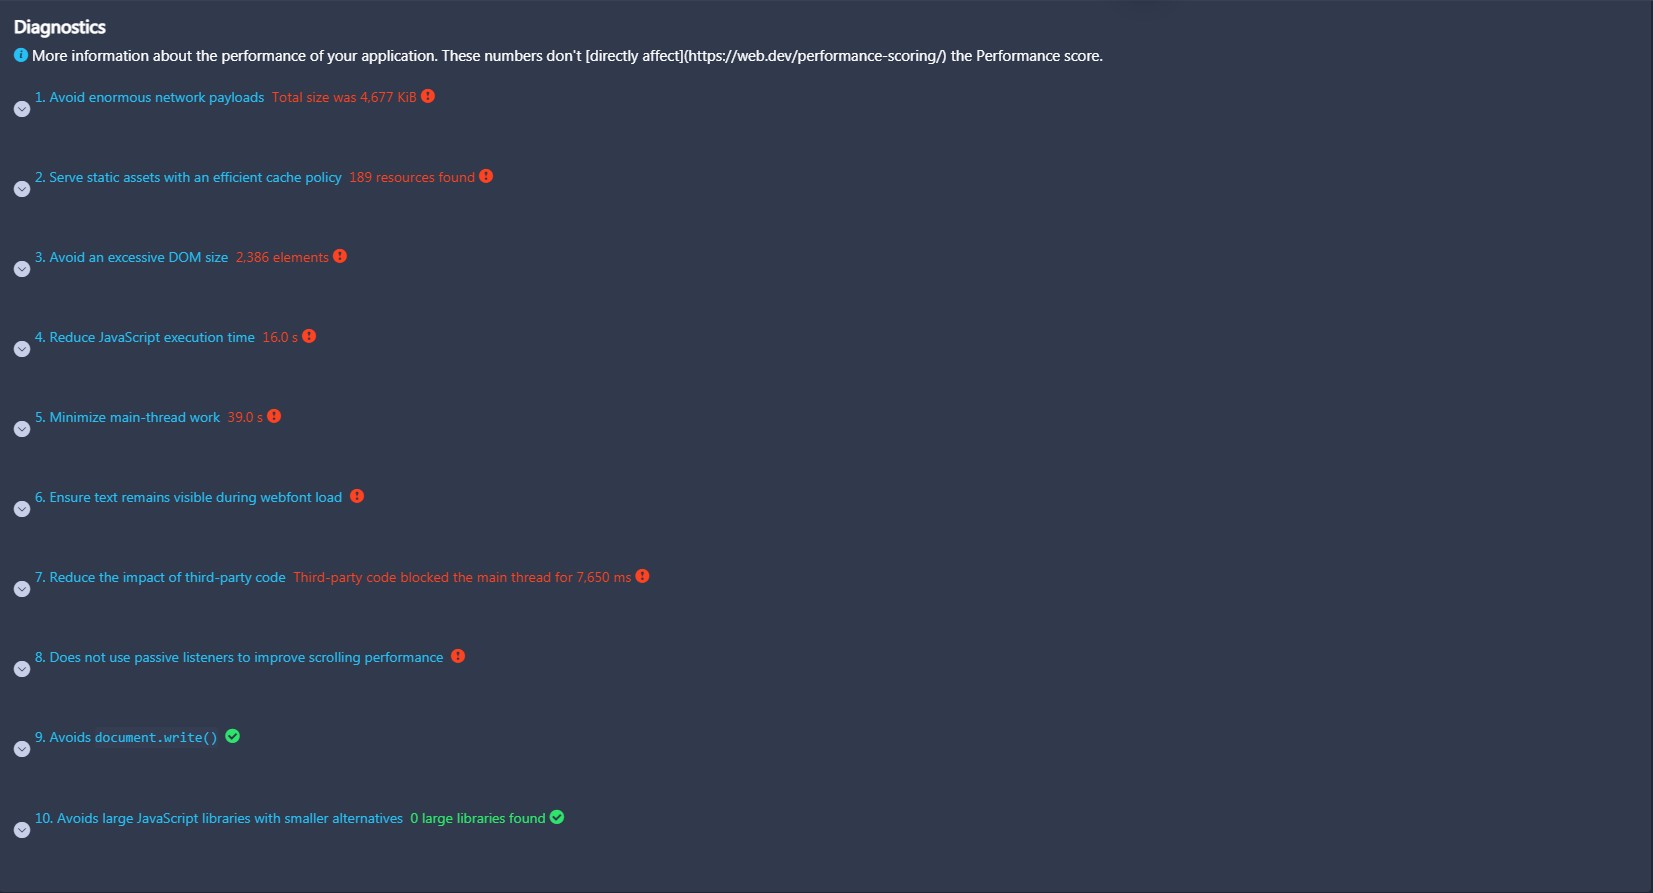
In the Diagnostics part, you will find tips on improving your application’s performance.
Accessibility section

In the Accessibility section, you can check your website’s accessibility score. The section is divided into seven parts: ARIA, Navigation, Contrast, Names and Labels, Internationalization and Localization, Tables and Lists, and Best Practices.
- In the ARIA part, you will find several tips on improving the usage of ARIA in your application which may enhance the experience for users of assistive technology, like a screen reader.
- In the Navigation part, you will find opportunities to improve keyboard navigation in your application.
- In the Contrast part, you will find opportunities to improve the legibility of your content.
- In the Names and Labels part, you will find opportunities to improve the semantics of the controls in your application. This may enhance the experience for users of assistive technology, like a screen reader.
- In the Internationalization and Localization part, you will find opportunities to improve the interpretation of your content by users in different locales.
- In the Tables and Lists part, you will find opportunities to improve the experience of reading tabular or list data using assistive technology, like a screen reader.
- In the Best Practices part, you will find common accessibility best practices.
Best Practices section
In the Best Practices section, you can check your website’s best practices score. You can also find several tips on improving user experience, trust and safety, and browser compatibility. The section is divided into four parts: Trust and Safety, User Experience, Browser Compatibility, and General.
- In the Trust and Safety part, you will find best practices to make your website a safer place and improve its trust.
- In the User Experience part, you will find best practices to improve mobile UX on your website.
- In the Browser Compatibility part, you will find best practices to make your website compatible with different mobile browsers.
- In the General part, you will find general best practices to improve your website.
SEO section
In the SEO section, you can check your website’s SEO score. Here, you can also find several tips on improving your website’s SEO. The section is divided into three parts: Mobile Friendly, Content Best Practices, and Crawling and Indexing.
- In the Mobile Friendly part, you will find tips on making your website more mobile-friendly.
- In the Content Best Practices part, you will find best practices to improve the content on your website.
- In the Crawling and Indexing part, you will find best practices to make search engines crawl and index your website faster.
PWA section
In the PWA section, you can check your website’s PWA score. Here, you can also find tips on improving PWA performance. The section is divided into three parts: Fast and Reliable, Installable, and PWA optimized.
Desktop
The Desktop part of the Lighthouse tool contains the same sections with identical metrics. The only difference is that it provides scores for the desktop version of your website.