The main purpose of the Detailed View section is to provide detailed ranking data. Keywords along with the info on them are displayed in the context of a certain search engine and timeframe.
The Detailed View section is divided into three parts: Control Panel, Detailed Overview Chart, and Detailed Details. The latter two provide comprehensive information about the performance of your keywords.
Control Panel

In the control panel, you have to select a search engine to form the chart and detailed information accordingly. You can also specify a date range for the data comparison. By default, the end date is today’s date, and the initial date is 30 days before today’s date.
Positions info is collected on a daily basis, right after 12 AM according to your time zone. However, you can click Update Rankings to update keyword positions and get the real-time info. The data will be updated to the current status in a few seconds.
Detailed Overview Chart
The graph shows the number of keywords and their percentage (i.e. the share of the total number of keywords added to the project). By default, it displays only keywords in Top100 and Top10. However, you can display Top5 and Top3 terms by clicking on the corresponding labels.
Hover your mouse over any point of the graph to see the exact number of keywords that were ranking in the corresponding TOP on a certain date.
You can display this information daily, weekly, or monthly. You can also change the way the data is displayed. By default, the chart shows the ranking sequence, but you can change it to ranking comparison, ETV dynamics, visibility dynamics, or average position dynamics.
- The ranking sequence chart shows how the number of your ranking keywords in TOP100, TOP10, TOP5, and TOP3 has been changing during the specified period.
- The ranking comparison chart enables you to compare the number of keywords in TOP100, TOP10, TOP5, and TOP3 between two dates.
- The ETV dynamics chart displays how your keywords’ estimated traffic value has been changing within the specified timeframe.
- The visibility dynamics chart demonstrates how your website’s visibility has been changing during the specified period.
- The average position dynamics chart shows how your project keywords’ average position has been changing within the specified period.
Detailed Details
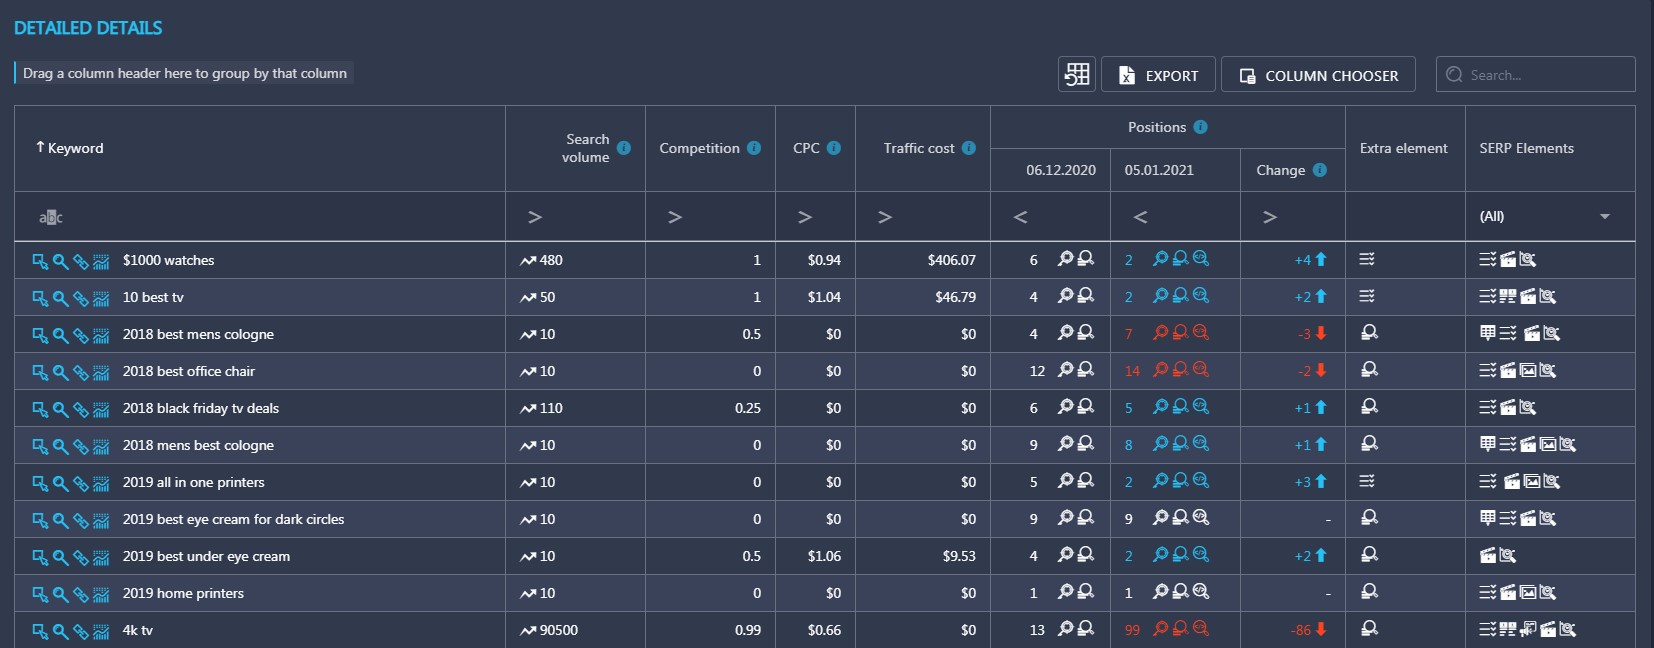
The table in the Detailed Details section shows you detailed information about your project keywords. Here’s a list of data points available in the table.
Keyword — in this column, you will all the keywords that you have added to the project.
Tags — here you will find all the tags assigned to certain keywords. Tags can be assigned in Rank Tracker’s settings section.
Search Volume — in this column, you will find your project keywords’ search volumes. This metric indicates the approximate number of monthly searches for a particular keyword in the framework of the selected search engine, language, and location. By clicking on the arrow next to the value, you can discover the Search Volume History. You’ll see the pop-up with the graph indicating the search volume for the last twelve months. All the data is taken from AdWords.
Positions — here you will find rankings of a particular keyword for the earliest and latest dates of the specified timeframe. You can also check the difference between the two. By clicking on the loupe icon next to the value, you can view a SERP snapshot for the end date.
In addition to default columns, there are also other parameters available in the Column Chooser.
How do I pull out additional columns from the Column Chooser?
- Click on the Column Chooser.
- Select the desired column.
- Drag a column header and drop it to the table.
Here’s the list of parameters available in the Column Chooser:
- Relevant URL refers to the page that ranks for a certain keyword.
- Competition represents the relative amount of competition associated with the given keyword in paid SERP only.
- CPC (Cost per Click) refers to the recommended bid for a particular keyword, according to Google Adwords.
- KEI (Keyword Efficiency Index) shows which keywords are likely to generate more traffic.
The higher the value, the easier to promote a keyword in TOP10 of SERP. The data is calculated by the following formula:KEI = (search volume) ^ 2 / (total number of results). - ETV (Estimated Traffic Value) helps estimate the traffic you can get to your website from a specific keyword.
The data is based on the spreading of traffic in the TOP20 and keywords’ search volumes.ETV = search volume * traffic distribution rate. - Traffic Cost shows how much paid traffic would cost in case you launch a PPC campaign. This data will enable you to estimate how successful your SEO-campaign is, and, if necessary, make a decision on the budget reallocation.
- Added displays the exact date when a specific keyword was added.
- Total Results is the number of results for a particular keyword and selected search engine.
- SERP Elements column shows which of the special SERP elements are displayed on a results page for a certain keyword. This information allows you not to miss additional possibilities for obtaining better website visibility.