The Scanned Pages section provides information about all scanned pages of your website. The graph on the screenshot below shows how many scanned and 2xx pages you had on each day of the specified timeframe.
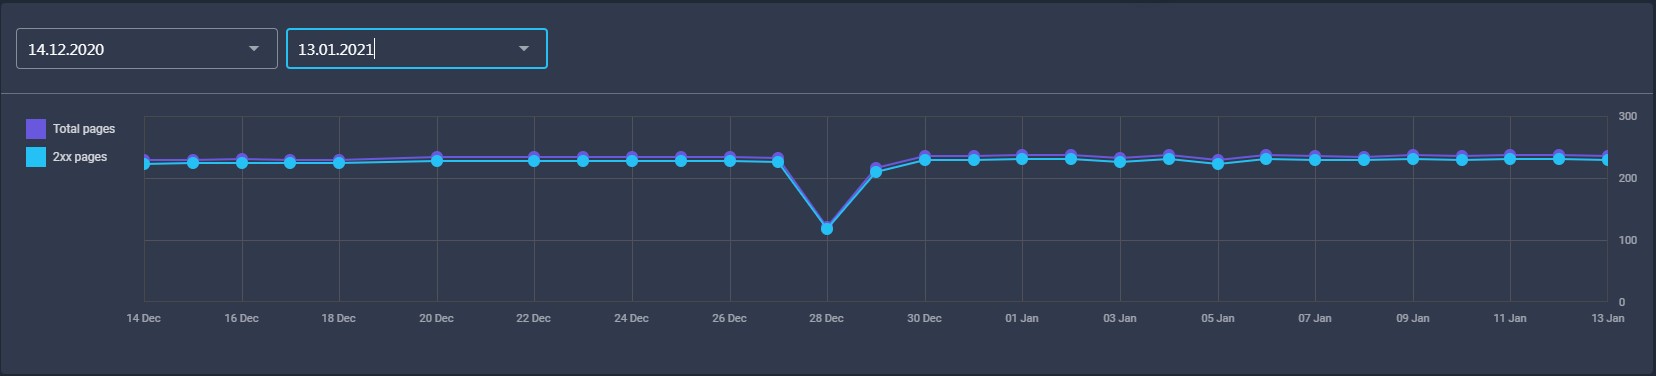
By default, the graph displays both total pages and 2xx pages but you can turn any parameter on and off by clicking on the corresponding icon.
Below the graph, you will find more detailed information about the scanned pages of your website.
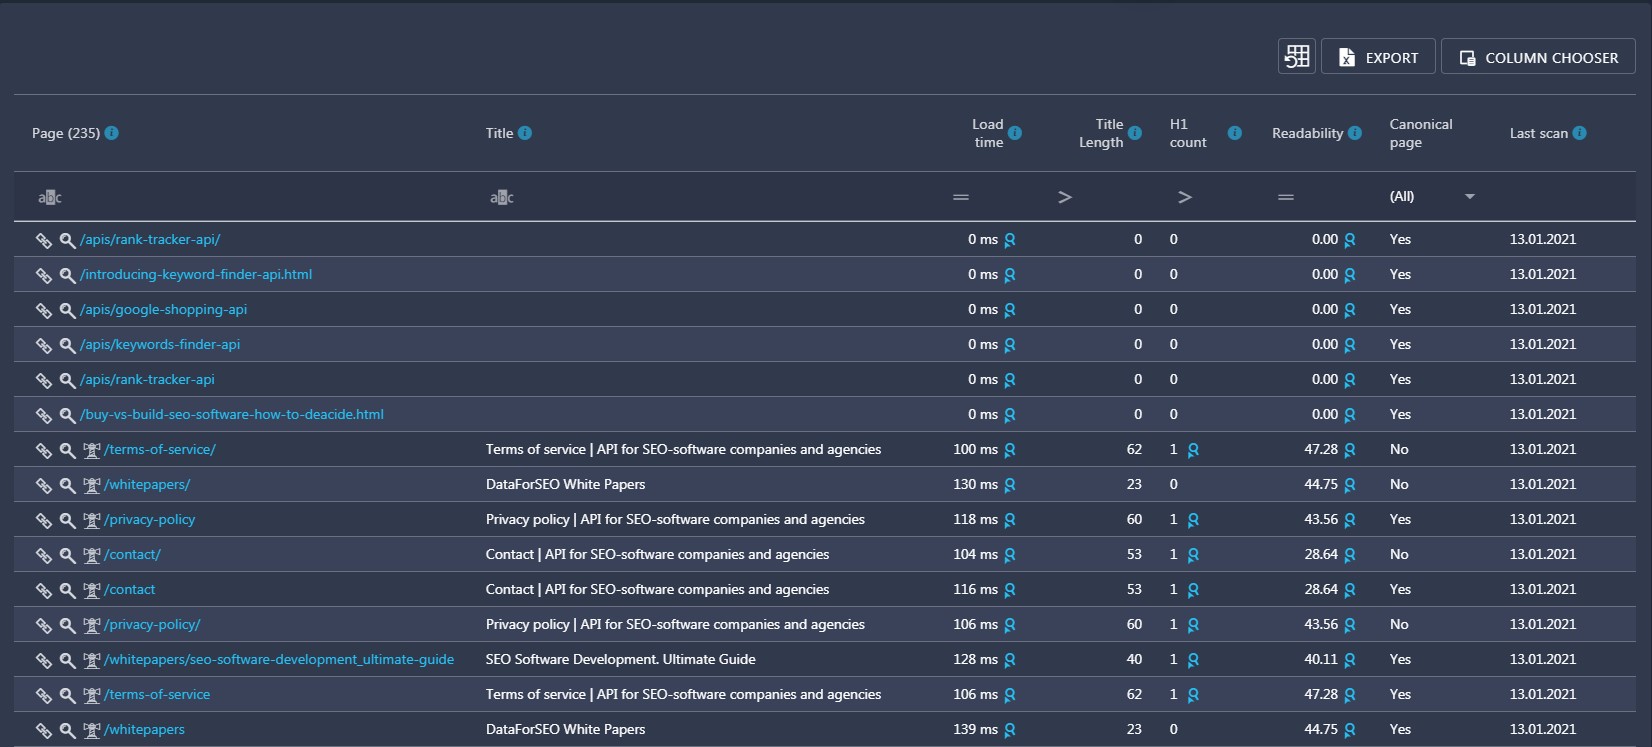
The Pages column shows URLs of all scanned pages of your website. You can click on ![]() icon next to a page URL to open it in a new tab. If you click on the loupe icon, the tool will analyze this page and provide you with info about its SEO performance.
icon next to a page URL to open it in a new tab. If you click on the loupe icon, the tool will analyze this page and provide you with info about its SEO performance.
If you click on the Lighthouse icon, the tool will analyze the performance of this page for mobile and desktop devices in the Lighthouse section of the tool. To learn how it works, you can read this article.
The Titles column shows <title> tags of the scanned pages.
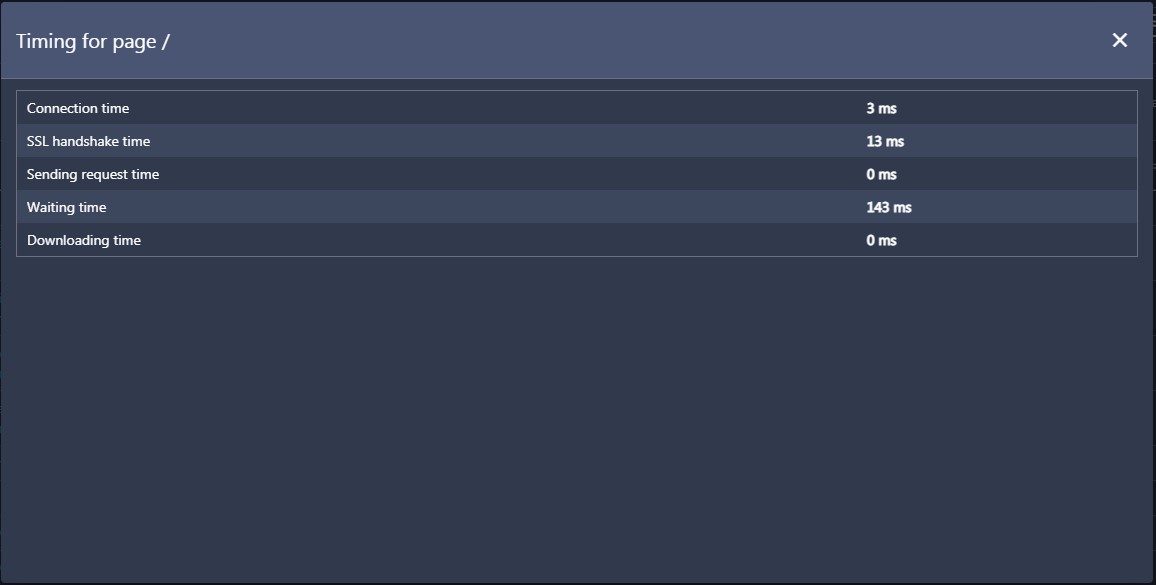
The Load Time column provides information about the load times of the scanned pages. You can click on the loupe icon next to the value to get more details.
The Title Length column shows the length in symbols of the <title> tag of each scanned page.
The H1 Count column displays how many <h1> tags each scanned page has.
The Readability column shows the readability score of each scanned page. The value in the table is based on the Flesch-Kincaid readability test. However, you can also discover scores based on other tests by clicking on the loupe icon.
The Canonical Page column shows whether a certain scanned page is canonical or not.
The Last Scan column displays the date when a certain page was last scanned.
How to add more columns
If a column you need isn’t in the table, you can pull it out from Column Chooser.
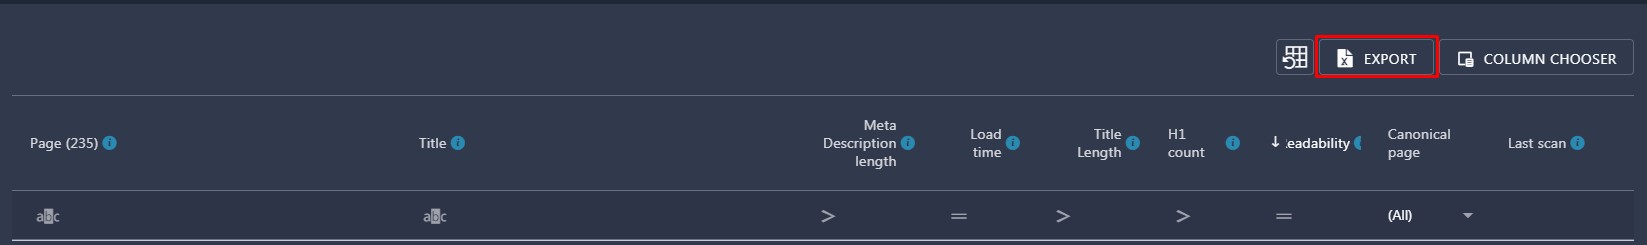
How to export the data
To export the data to an xlsx file, click on the Export button.