The Day-by-Day View section is designed to provide information about the daily performance of project keywords. It consists of two parts: Day-By-Day Overview Chart and Day-By-Day details.
Day-By-Day Overview Chart
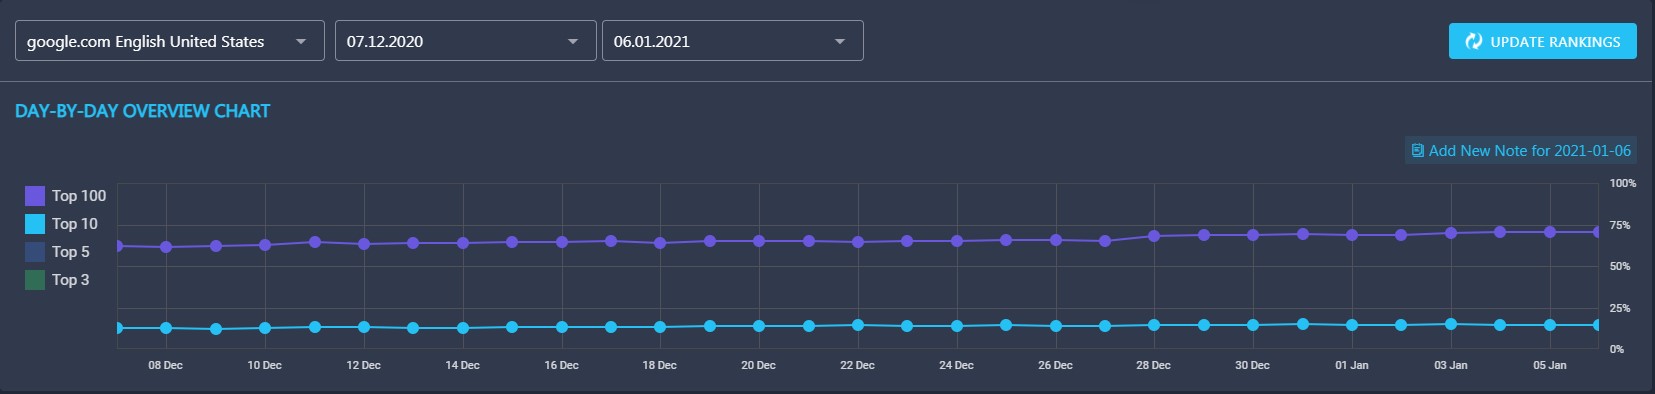
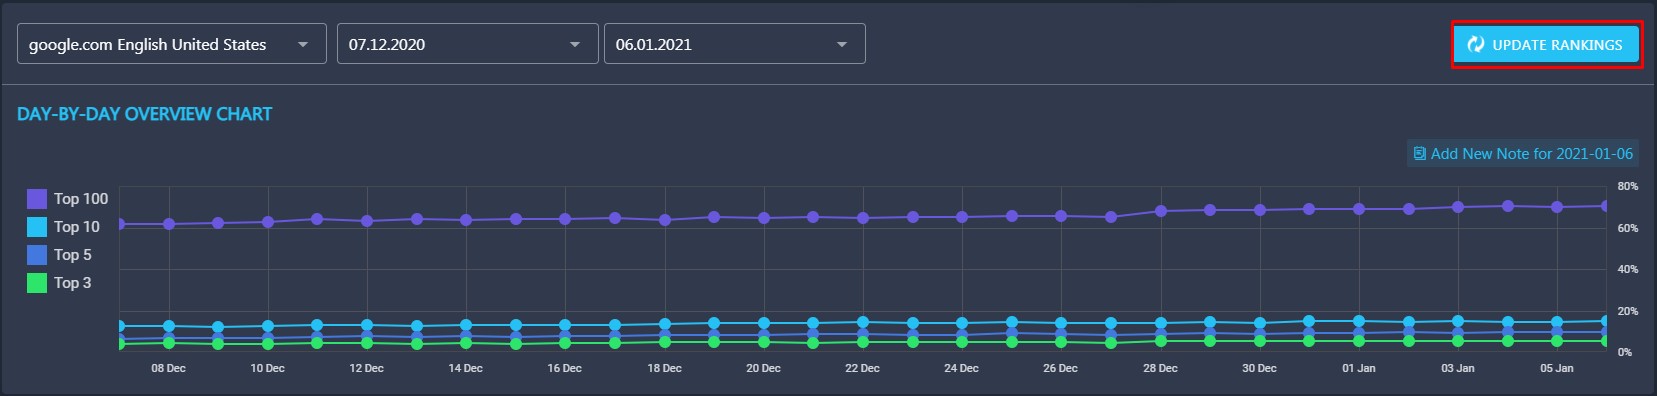
The Day-By-Day Overview chart displays the number and percentage of project keywords ranking in various TOPs on each date of the specified timeframe. By default, it shows results for TOP100 and TOP10, but you can also display data for TOP5 and TOP3 by clicking on the corresponding icons.

The keyword data is updated automatically on a daily basis, right after 12 AM according to your time zone. But if you don’t want to wait for it to update, you can click the Update Rankings button and get the real-time info instantly.
Day-By-Day Details
In the Day-By-Day Details table, you will find detailed information on each keyword added to the project.
In the Keyword column, all project keywords are stored. There are loup and chain icons near them. By clicking on the loup icon, you will be redirected to the search results page so that you can see depersonalized SERP results for the specified search engine, language, and location. By clicking on the chain icon, you will be redirected to the page relevant for a specific keyword.
The Search Volume column displays search volumes for all project keywords. This metric represents the approximate number of monthly searches for a certain term. The data is extracted from Google Adwords.
The Change column shows changes in your keywords’ visibility. The blue number indicates that a certain keyword won positions while the red line means that a term lost its positions. You can see the changes on any keyword’s visibility for each day of the specified timeframe. Moreover, you can also load a SERP snapshot for any date within that period.