The Audience Analytics section enables you to observe information about your website’s visitors. The data is presented in chart and spreadsheet forms for the specified timeframe (a month by default).
The section is divided into four parts: Visits By Date, Demographics, System, and Mobile.
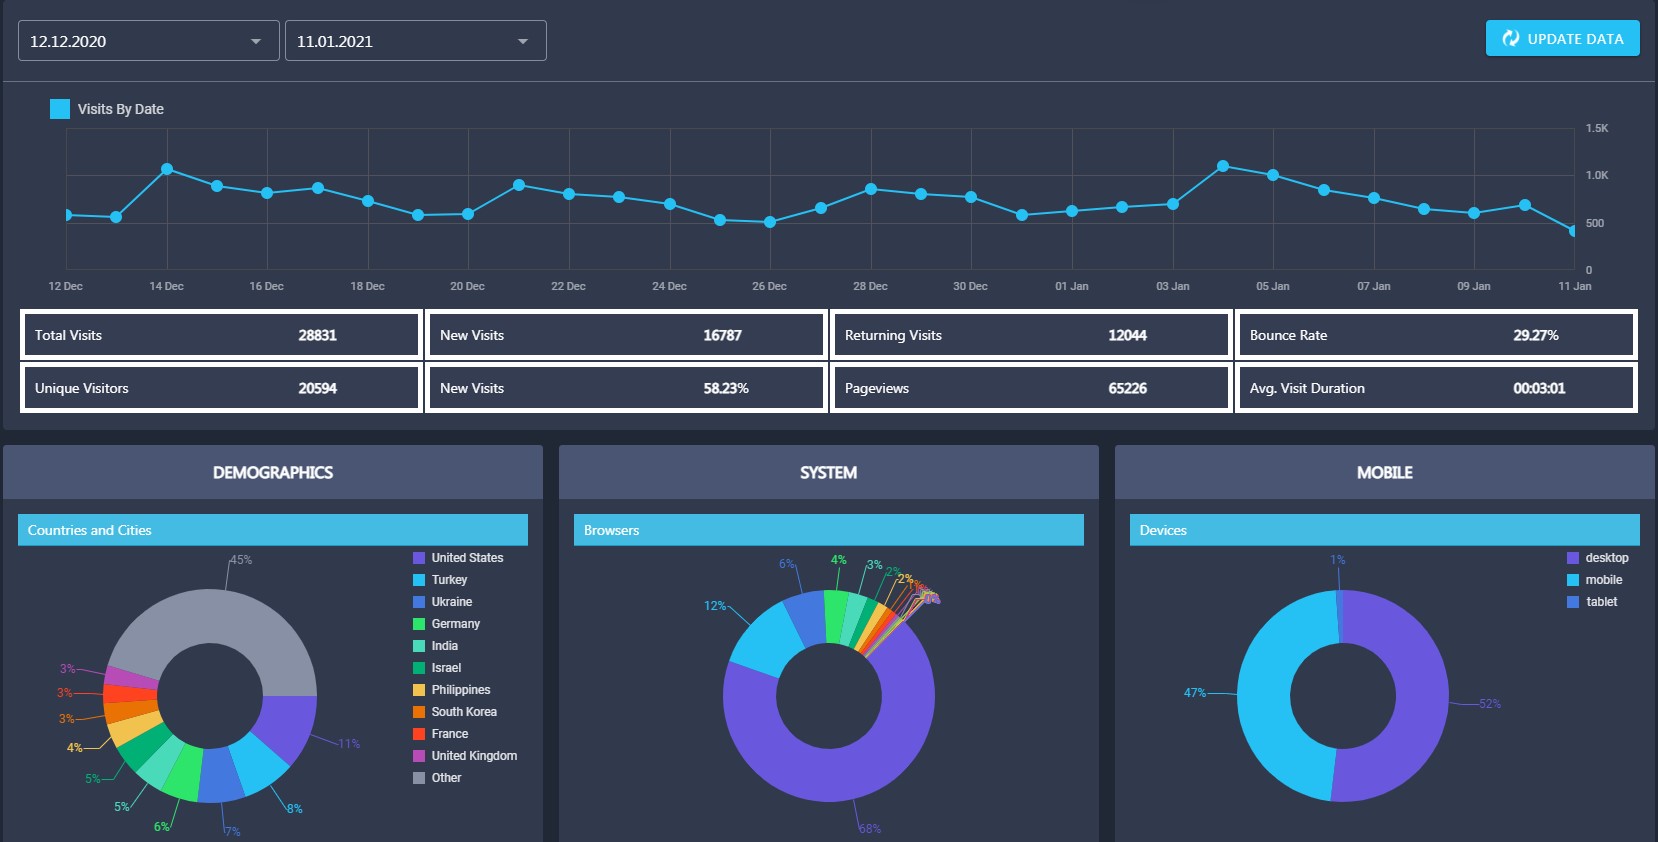
Visits By Date
The Visits By Date section displays how many visits you had on each day of the specified period. Along with the number of visits, it shows other analytics data, such as Total Visits, Unique Visitors, New Visits (number and percentage), Returning Visits, Pageviews, Bounce Rate, and Avg. Visit Duration.
Total Visits represents the summary of all visits to your website within the specified timeframe.
Unique Visitors refers to the actual number of users who have come to your website during the specified period.
New Visits displays the number and percent of users who have visited your website for the first time within the specified timeframe.
Returning Visits shows the number of users who have revisited your website at least once after the initial visit within the specified period.
Pageviews refers to the total number of pages viewed by your visitors within the specified timeframe.
Bounce rate displays the percentage of single-page visits to your website.
Avg. Visit Duration shows the average amount of time users spend on your website.
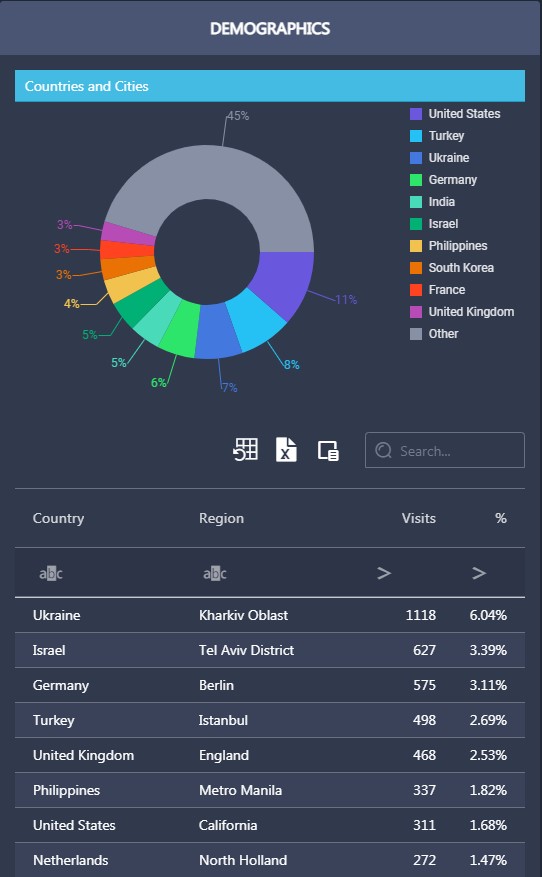
Demographics
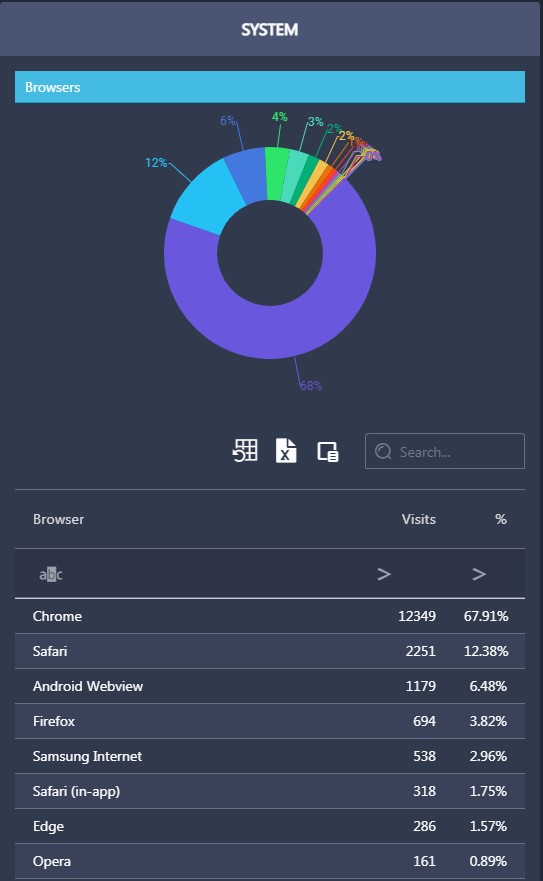
System
Mobile
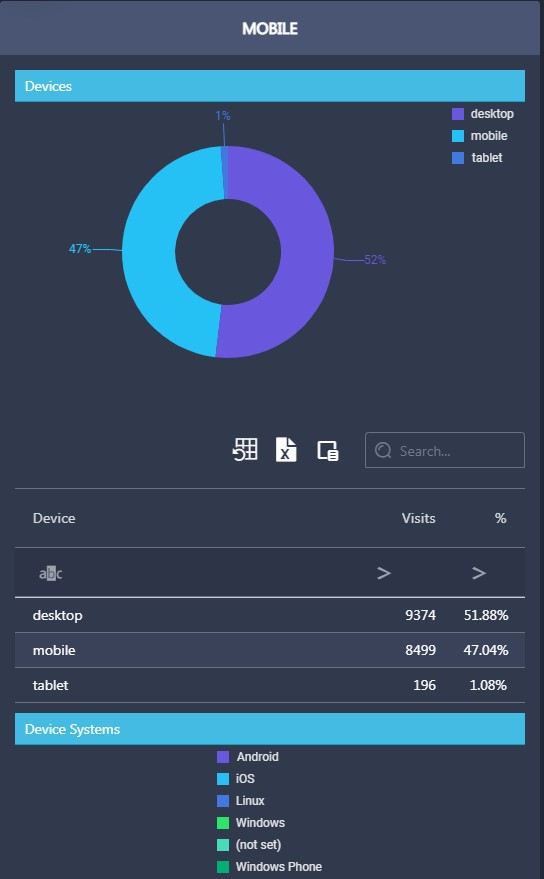
You can export each table’s data by clicking on the corresponding button.