Customizable tables underpin the mapping of data in our platform. Even though they display different metrics for each individual tool, the basic understanding of how they work will enable you to use the full capacity of our products and features.
Tables management gives a possibility to add additional parameters, use multi-filtration, and export the desired data.
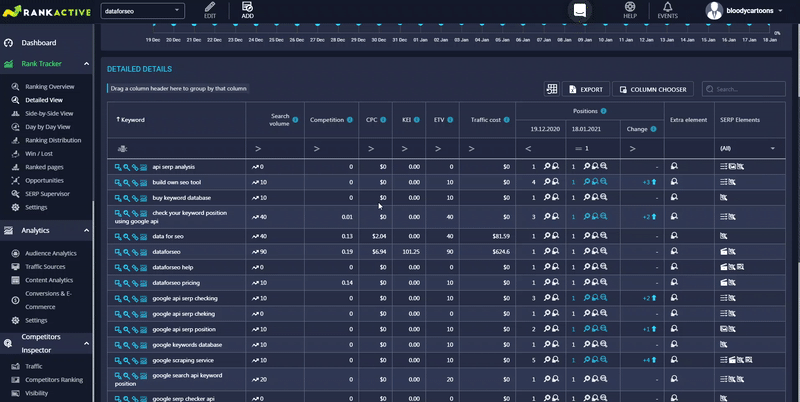
Column Chooser
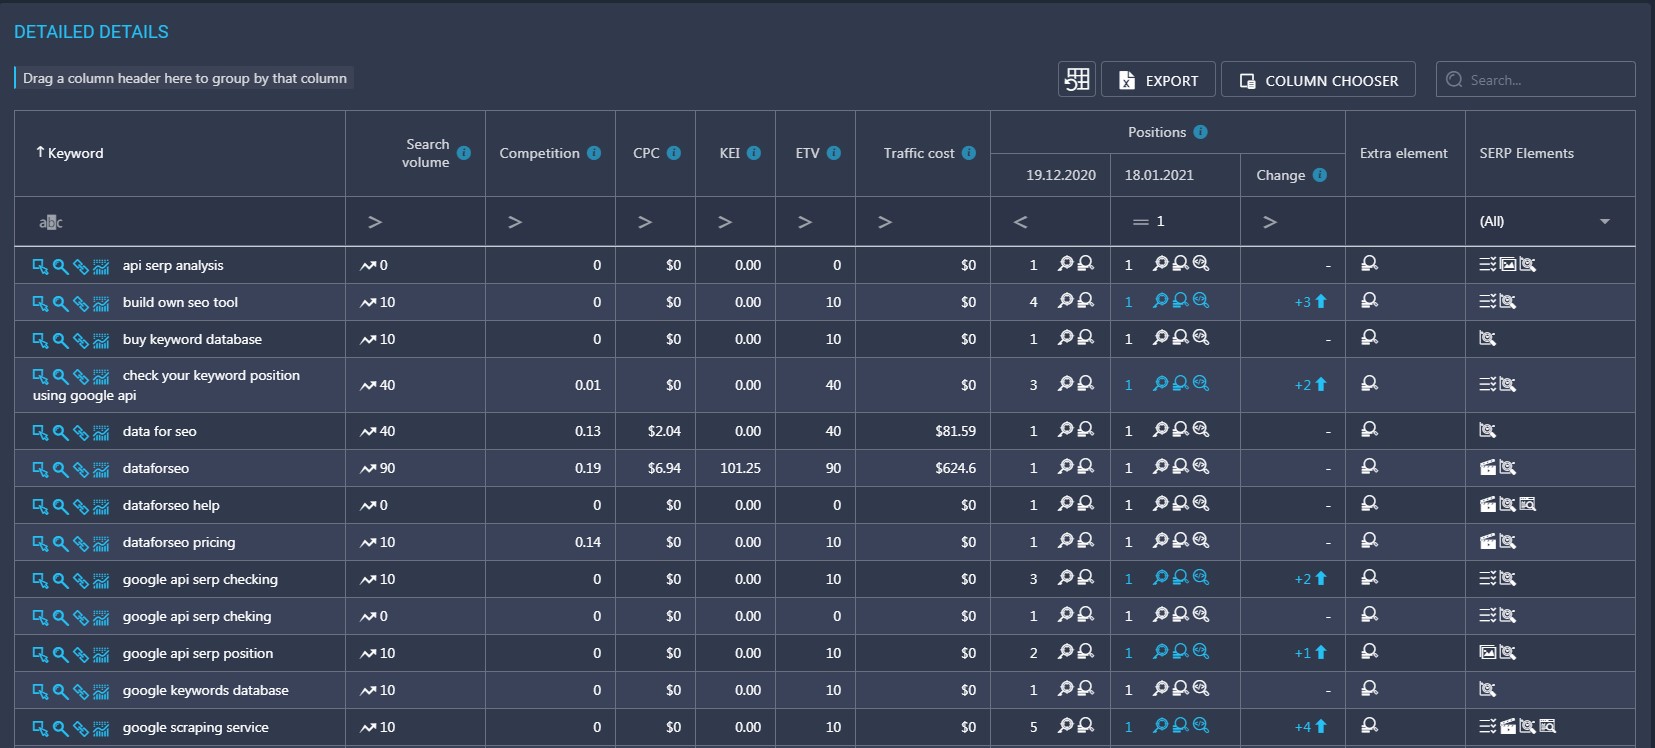
Almost every section of our tools has a table that includes several default parameters. Column Chooser is designed to hide unnecessary parameters and/or add the ones that are important for your current tasks.
For example, if you visit the Detailed view section, you will find a table with search volume, competition, CPC, KEI, ETV, and other useful keyword metrics.
If you want to add some more parameters, just open Column Chooser and tick them.
To remove some of the metrics from the table, open Column Chooser and untick the unnecessary parameters.
Multi-filtration
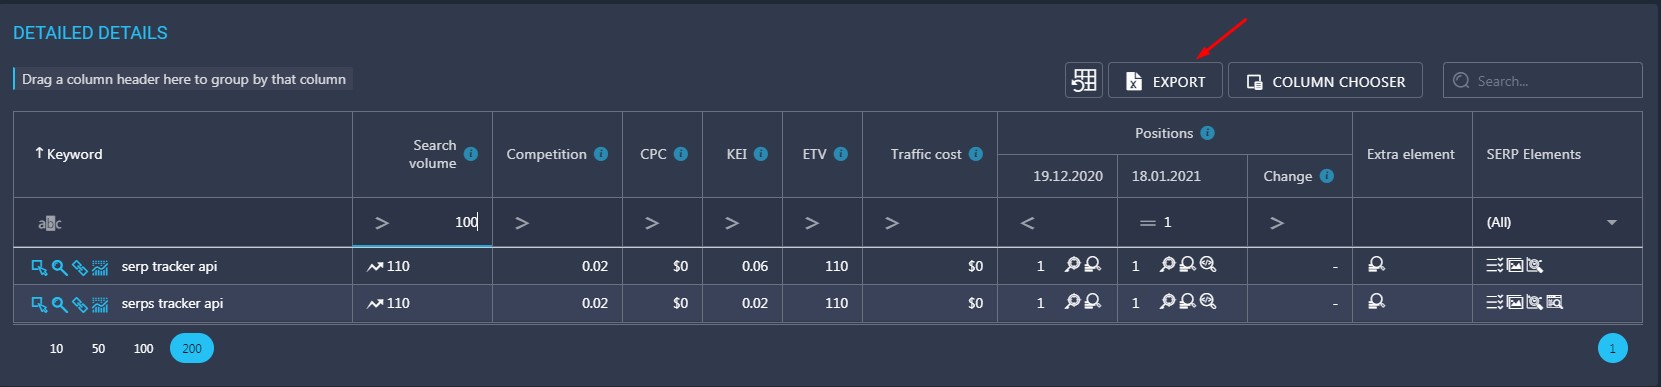
Multi-filtration enables you to filter keywords from the table by any of its parameters. For example, you can display only the terms that have search volume greater than 100. To do so, you have to apply a filter.
If you do something wrong, you can always reset the grid by clicking on this icon ![]() .
.
Data Export
Once you finish filtering data, you can export it in an Excel file. Please note that only visible data will be exported – hidden columns will not be included in a report. To export data from the table, click on the Export button.