In the Dashboard section, you can find general information about your project websites.
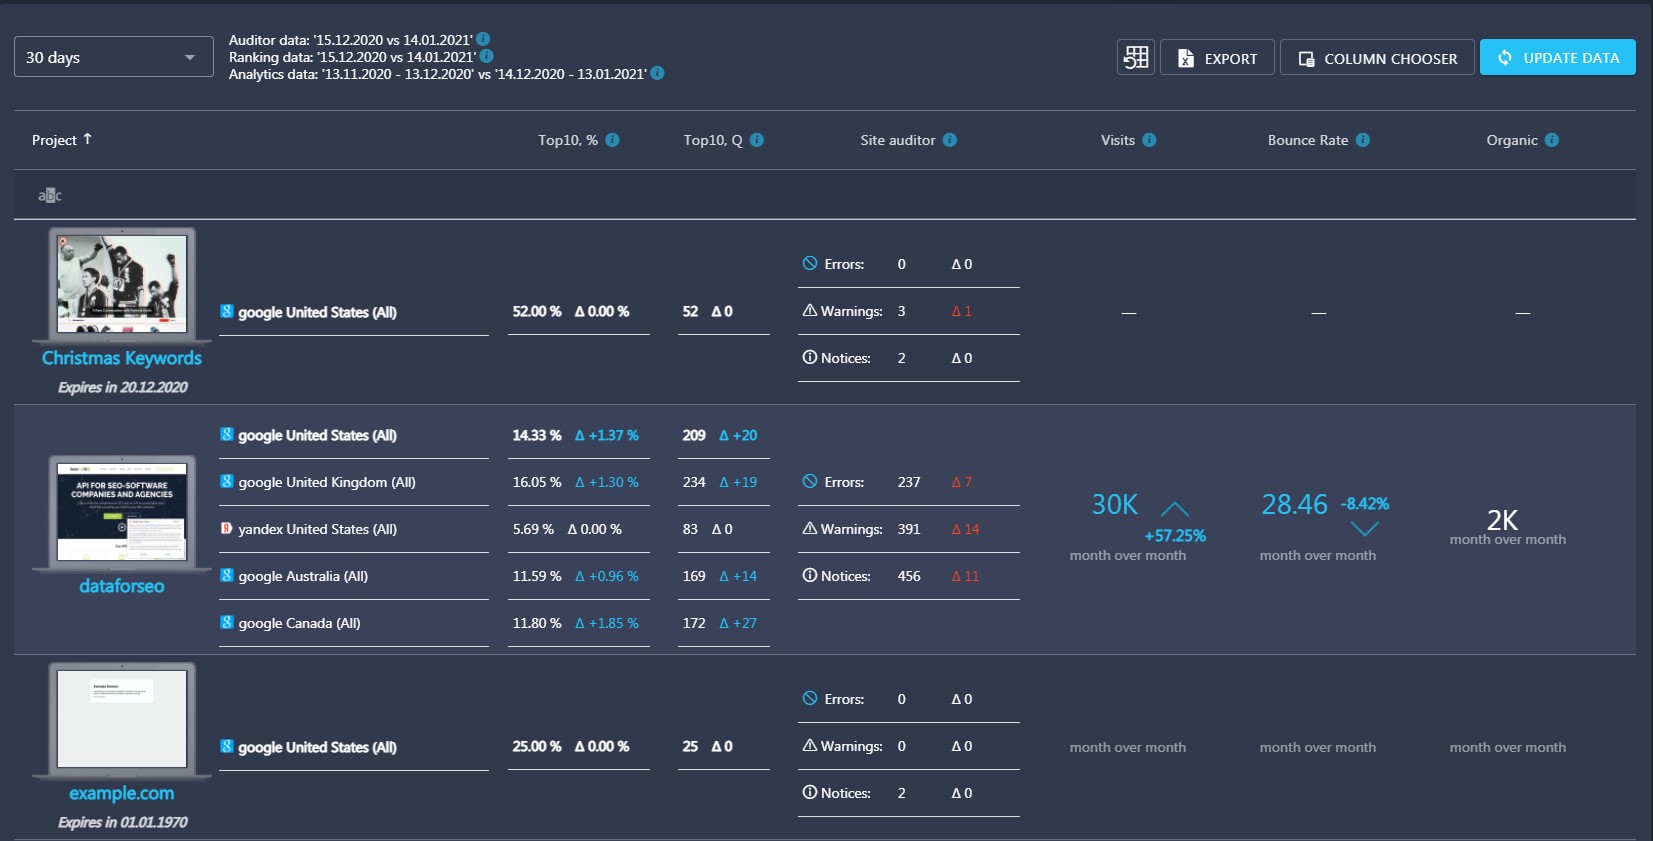
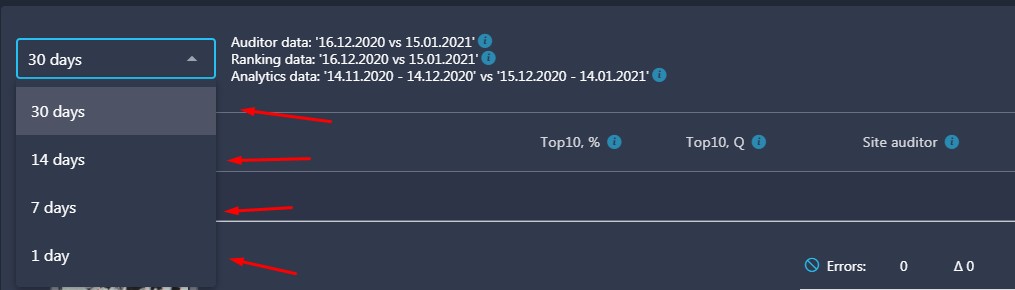
By default, the dashboard displays data for the last 30 days but you can display it for 14 days, 7 days, or 1 day.
The dashboard displays a project name, the percentage of keywords in Top10, the number of keywords in Top10, the Number of Errors, Warnings, and Notices in Site Auditor, the number of visits and dynamics of changes in percentage, Bounce Rate, and the total number of organic visits.
If you want to add more metrics to the table, you can pull them out from Column Chooser.
You can also click on any project to discover more detailed information.
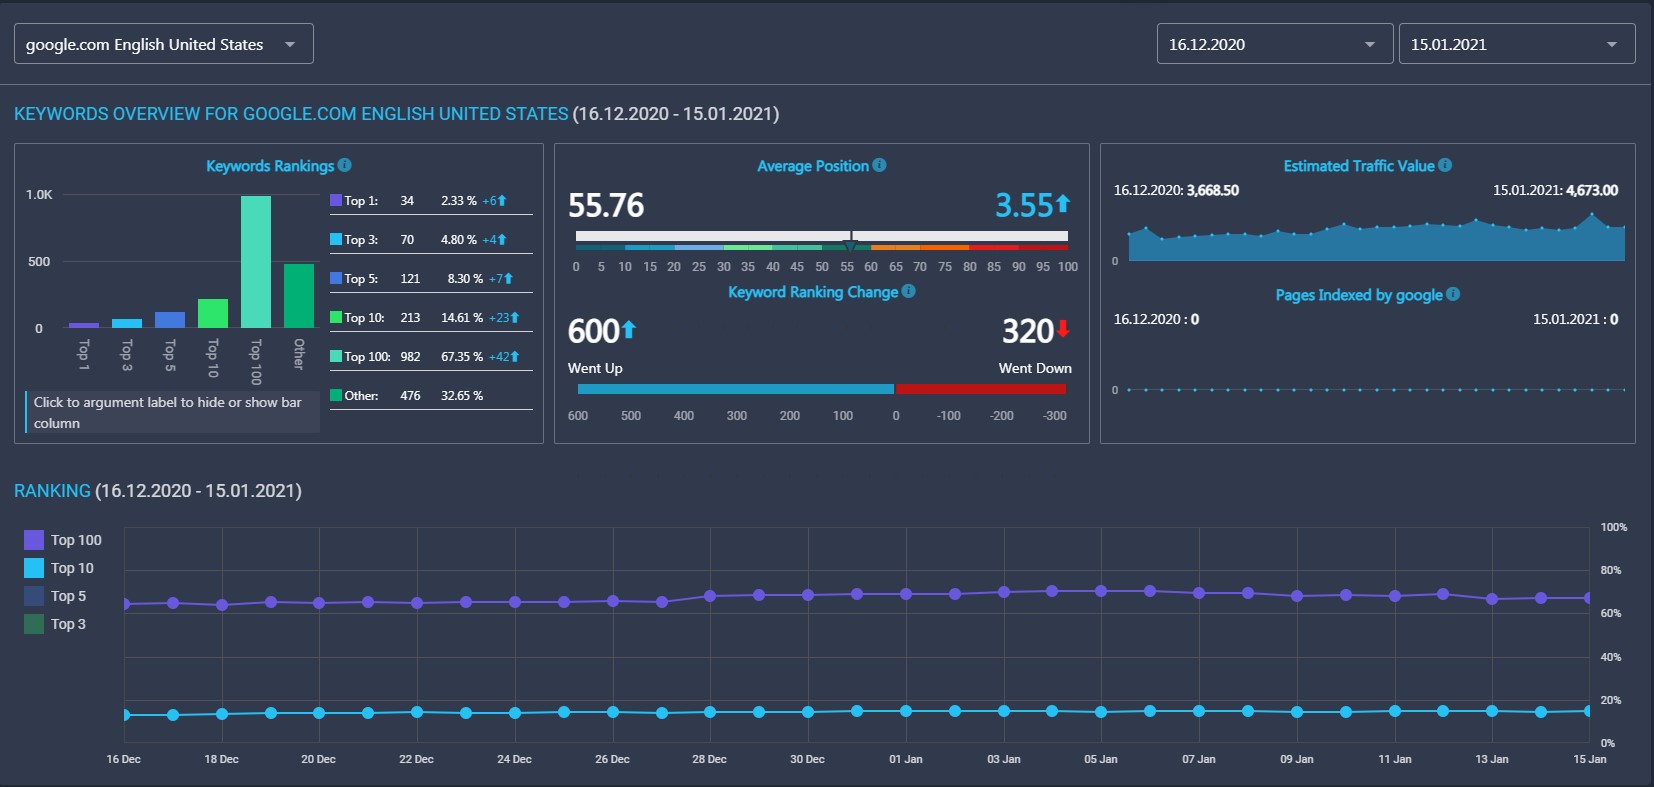
The information as in the screenshot above is shown for the specified timeframe (a month by default).
The detailed dashboard is divided into five parts: Keywords Overview, Ranking, Traffic Overview, Goals Overview, and Site Auditor.
Keywords Overview
The Keywords Overview section is divided into five parts, each of which represents a particular dataset related to your keyword rankings.
- Keyword Ranking. On the bar chart, you can see the ranking distribution between Top 1, Top 3, Top 5, Top 10, and Top 100. The data is collected with a search depth of up to 100 results. Keywords that are not found in the search engine’s Top 100 are marked as “Other”. You may also check out the numbers of terms that dropped out or entered a certain Top at the table right next to the bar chart.

- Average Position. The average position scale indicates the arithmetic mean of all keywords’ positions. Please note that keywords not included in Top 100, take the value of 1 when the calculation is carried out.
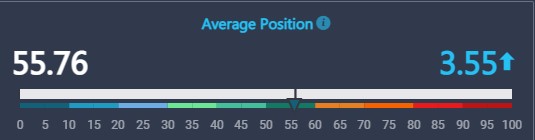
For example, if four project keywords have positions 10, 8, 4, and 30, the Average Position of your project would be: (10+8+4+30)/4 = 13.
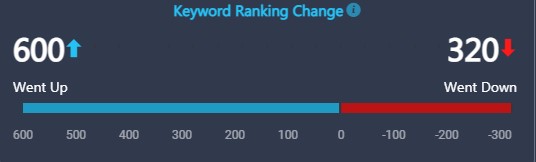
- Keyword Ranking Change. The scale of Keyword Ranking Change indicates how many keywords added to the project went up or down. The comparison is done between the initial and the end date of the specified timeframe.
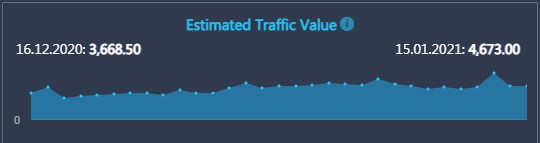
- Estimated Traffic Value (ETV) indicates the expected traffic you can get to your website from all of your project keywords. The calculation is based on the Search Volume of each keyword and traffic distribution coefficient in SERP. Click here to learn how we calculate ETV
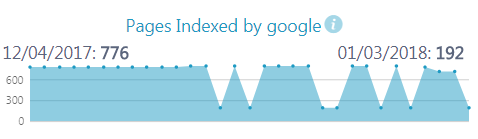
- Pages Indexed. This block corresponds to a number of pages indexed by a particular search engine. This data is collected on a daily basis.
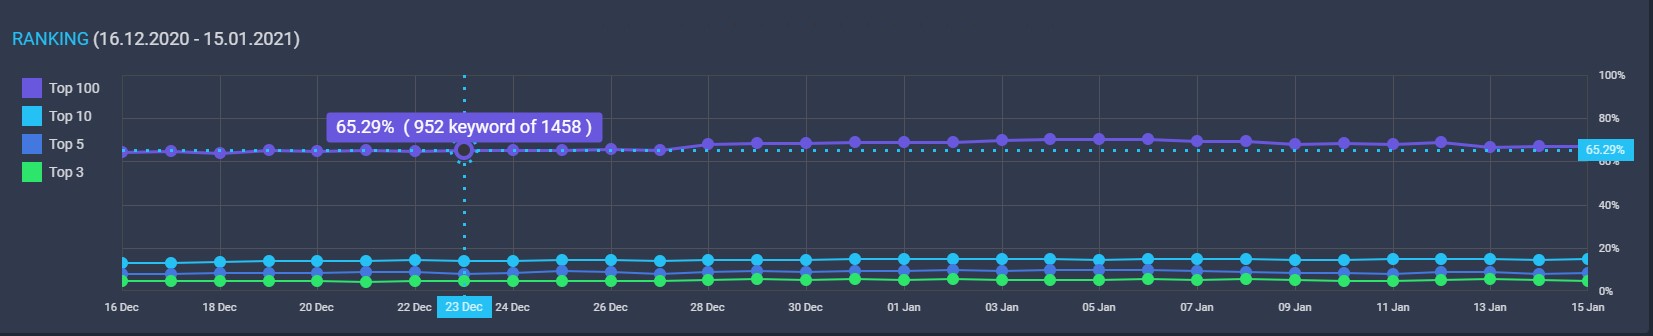
Ranking
In the Ranking section, you can discover the number and percentage of keywords ranking in Top 3, Top 5, Top 10, and Top 10 you had on each day of the specified timeframe. Hover your mouse over any point of the graph to see the exact number and percentage of keywords that were ranking in the corresponding TOP on a certain day.
Traffic overview
The Traffic Overview section displays the traffic info obtained from Google Analytics. In the graph, you can see how many visits you had on each day of the specified timeframe. Hower your mouse over any point to see the exact number of visits on a certain day.
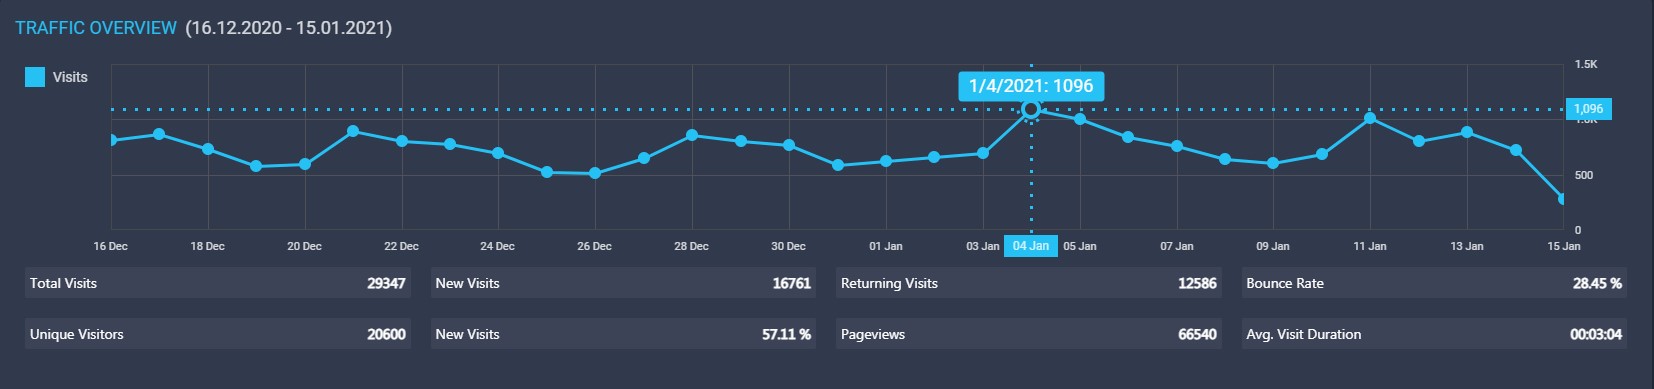
Primary indicators like Total Visits, Unique Visitors, New Visits, Returning Visits, Pageviews, Bounce Rate, and Average Visit Duration can be found below the line graph.
- Total Visits represents the summary of all visits to your website within the specified timeframe.
- Unique Visitors refers to the actual number of users who have come to your website during the specified period.
- New Visits displays the number and percent of users who have visited your website for the first time within the specified timeframe.
- Returning Visits shows the number of users who have revisited your website at least once after the initial visit within the specified period.
- Pageviews refers to the total number of pages viewed by your visitors within the specified timeframe.
- Bounce rate displays the percentage of single-page visits to your website.
- Avg. Visit Duration shows the average amount of time users spend on your website.
Goals Overview
Goals Overview represents the key information about the project’s conversions for the specified search engines and timeframe. The graph shows the total number of completed goals day by day. Hower your mouse over any point to see the exact number of goals you completed on a certain day.

You can find the key indicators (Goal Completions, Register, Goal Value, Goal Conversion Rate, and Total Abandonment Rate) below the line chart.
- Goal Completions represents the total number of goals that have been completed within the specified timeframe.
- Goal Value is a dollar amount associated with actions completed by users on your website during the specified period.
- Goal Conversion Rate represents the percentage of visitors who completed goals on your website within the specified timeframe.
- Total Abandonment Rate refers to the percentage of visitors who have commenced your defined conversion process but have failed to convert on the goal during the specified period.
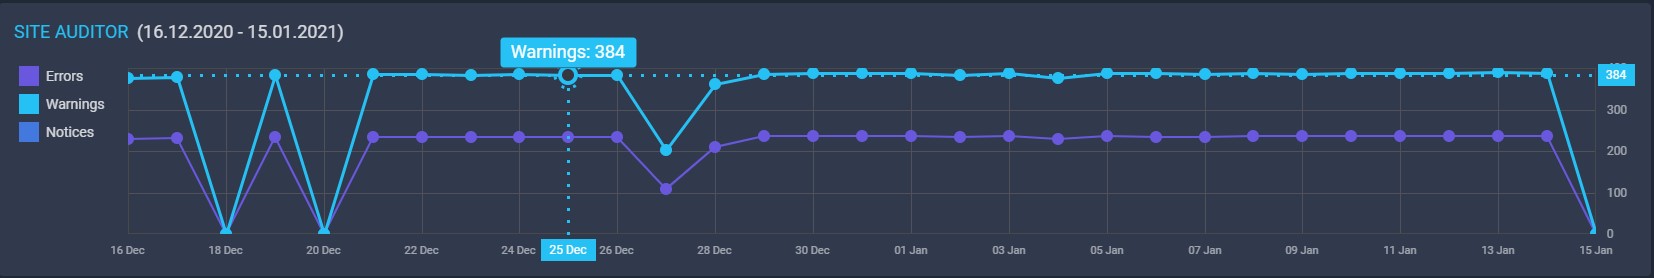
Site Auditor
The Site Auditor chart represents the number of Errors, Warnings, and Notices on your website. Hower your mouse over any point to see the exact number of certain warnings you had on a specific day.
- Errors: Empty titles, Duplicate titles, 4xx pages, 5xx pages, Duplicate title tags, Duplicate meta tags, Recursive canonicals, Pages with broken links.
- Warnings: Title too short, Title too long, Empty description, Duplicate descriptions, Duplicate pages, 3xx pages, Invalid Images alt, Invalid Images title, Too high load time, Too high waiting time, Disabled Compression, Deprecated HTML tags, Irrelevant title, Irrelevant meta keywords, Irrelevant meta description, Spelling Mistakes, Absent H1 tags, Pages with lorem ipsum.
- Notices: Invalid page size, Invalid plaintext size, Invalid plaintext rate, Pages with flash, Pages with a frame, Empty meta keywords, Not SEO-friendly URL, Non-canonical pages, Absent encoding meta tag, absent doctype, www/non-www pages, http/https pages.
Click here to learn more about Site Auditor data