The Content Analytics section provides comprehensive information about content performance. It is divided into two parts: Pageviews By Date and TOP10 First Level Pageviews + TOP100 Pages.
Pageviews by Date

In the Pageviews By Date section, you can discover the number of pageviews you had on each day of the specified timeframe. Along with that information, you will also find several content performance metrics such as Pageviews (total), Unique Pageviews, Pageviews Per Session, Entrances, Exit Rate, Avg. Time On Page, Bounce Rate, and Page Values.
Pageviews represents the total number of pages that have been viewed by your visitors within the specified period.
Unique Pageviews indicates the number of views generated by users during single sessions. If a user revisits the page during one session, Analytics doesn’t count it as a unique page view.
Pageviews Per Session shows how many pages visitors view within single sessions on average.
Entrances is the metric recorded by Analytics for each page that a user begins a new session on. Here the total value for all website pages is presented.
Exit rate shows the percentage of visitors who end their sessions after viewing a particular page. It is calculated by the following formula: Re = (Texists / Tviews)*100%, where Re — exit rate, Texits — total exits, and Tviews — total visits to a page. In this section, the total percentage for all pages is presented.
Avg. Time On Page displays how much time users spend on all pages of your website on average.
Bounce rate refers to the percentage of single-page visits to a website. It is calculated by the following formula: Rb = (Tv / Te)*100%, where Rb — bounce rate, Tv — total number of single-page visits, and Te — total entries to a page. In this section, the total percentage for all website pages is presented.
Pages Values shows which pages users view before completing a goal (making a transaction, submitting a contact form, etc.). Here the value for all pages is presented.
Top10 First Level Pageviews + Top100 Pages
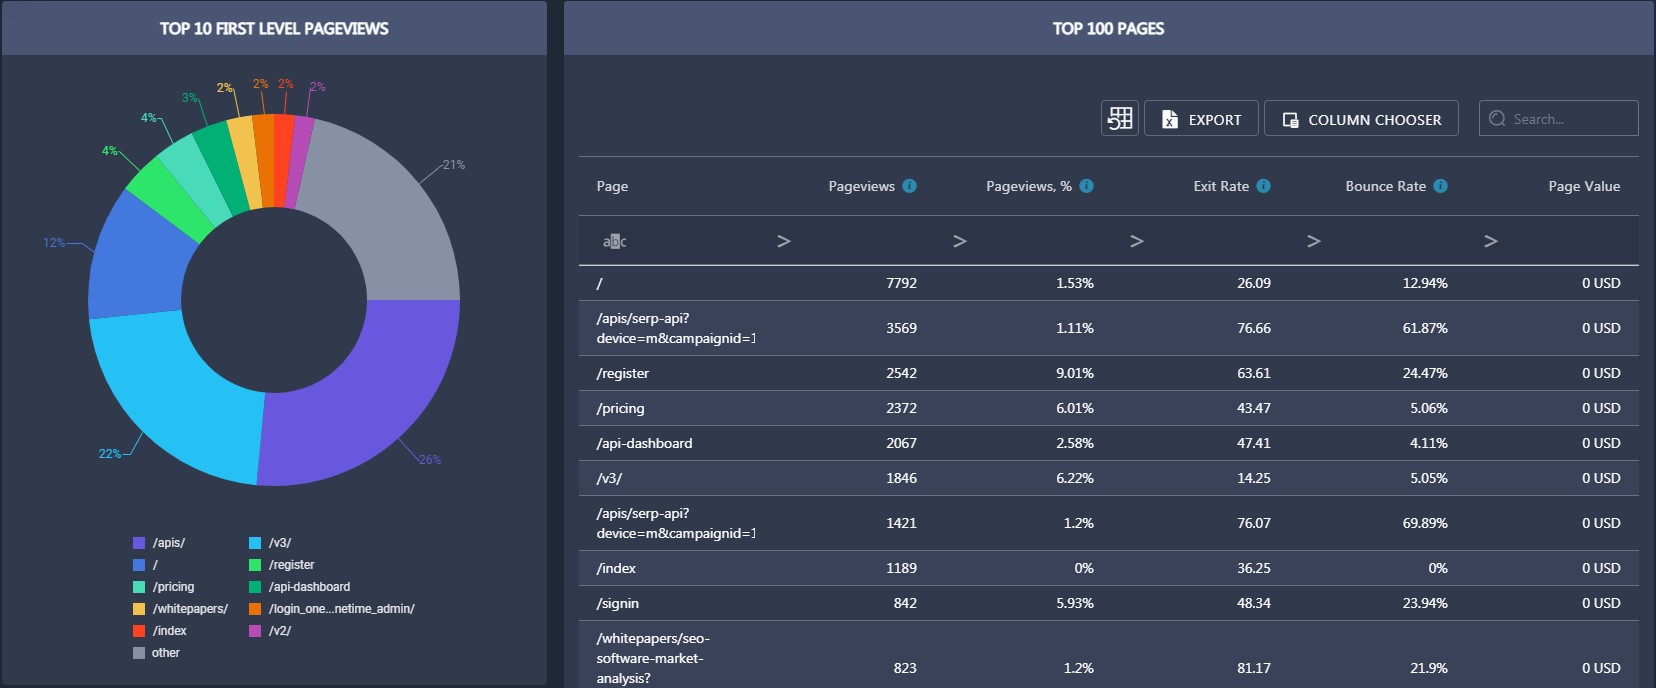
In the Top10 First Level Pageviews graph, you can discover the TOP 10 pages your visitors most often begin their sessions with. In other words, it displays the best-performing pages of your website. In the Top100 pages table, you can see top100 best-performing pages accordingly. Along with page URLs, the table provides several content performance metrics for each individual page. If the metric you need isn’t in the table, you can pull it out in Column Chooser.
You can also sort the results in the table by any of these metrics. For example, you can easily find pages with high bounce rates by applying the corresponding filter.
You can also export data from the table by clicking on the Export button.
