This section provides information about ranked pages relevant to keywords ranking in TOP100. It is divided into two parts: Relevant Pages Chart and Relevant Pages Details.
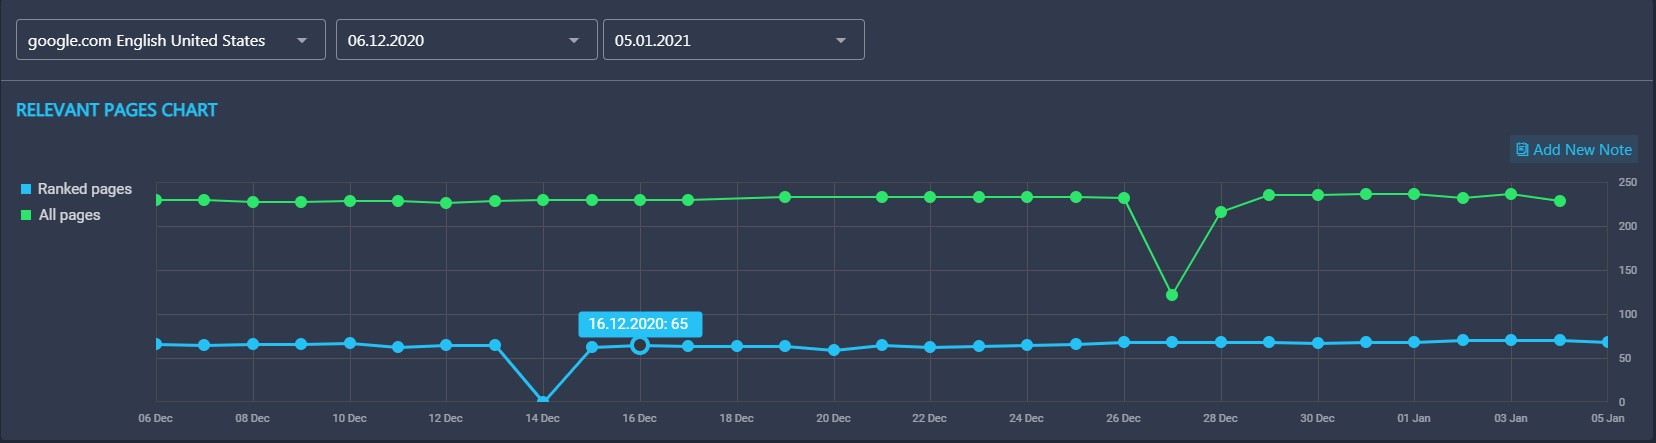
Relevant pages chart
The Relevant Pages Chart shows the number of ranked pages and the number of all pages of your website. The green line represents all pages your website has while the blue one shows the pages ranking in TOP100. The data is collected for the specified timeframe (last 30 days by default).
You can check how many ranked pages your website had on a certain day by hovering your mouse over the corresponding point on the chart.
Relevant pages details
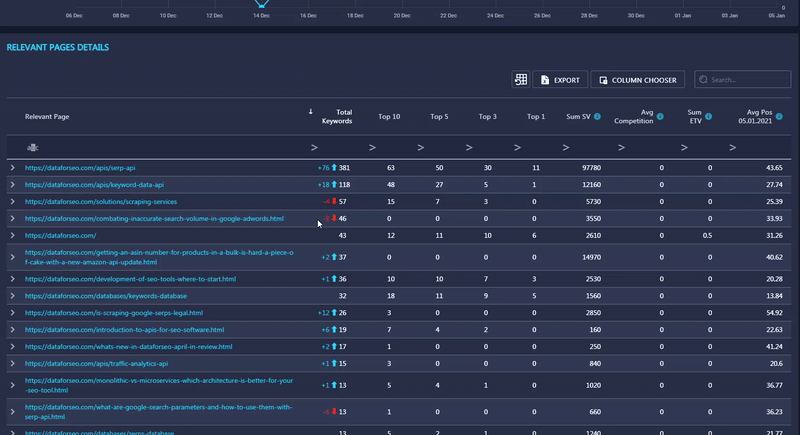
The Relevant Pages Details section provides more detailed info about the ranked pages of your website.
The Relevant Pages column displays a full list of ranked pages.
The Total Keywords column shows how many keywords a certain page is currently ranking for. You can discover those keywords along with their positions by clicking on the arrow next to a relevant page’s URL.
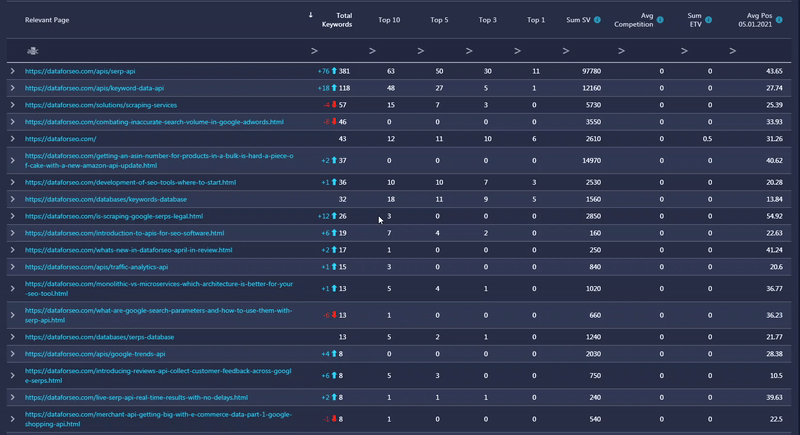
On the left, next to the number of total keywords, there is a blue or red-colored arrow. The blue arrow is presented if the number of ranking keywords for a particular page increased and the red arrow is presented if this number decreased. These numbers are based on the data comparison between the initial and the end date of the specified period.
The TOP10, TOP5, TOP3, and TOP1 columns display the number of keywords ranking in TOP10, TOP5, TOP3, and TOP1 accordingly.
You can also pull out additional table columns by using Column Chooser. So far, it contains the following metrics: Sum Search Volume, Sum ETV, Average Competition, Average Keyword Efficiency Index Value, Average Cost per Click, Sum Traffic Cost, and Average ranking change. To learn what these metrics mean, please read this article.