The Ranking Overview section is aimed at providing the whole picture of what is going on with website rankings. All information is given for a particular search engine and timeframe. It can be displayed daily, weekly, or monthly.
Performance indicators
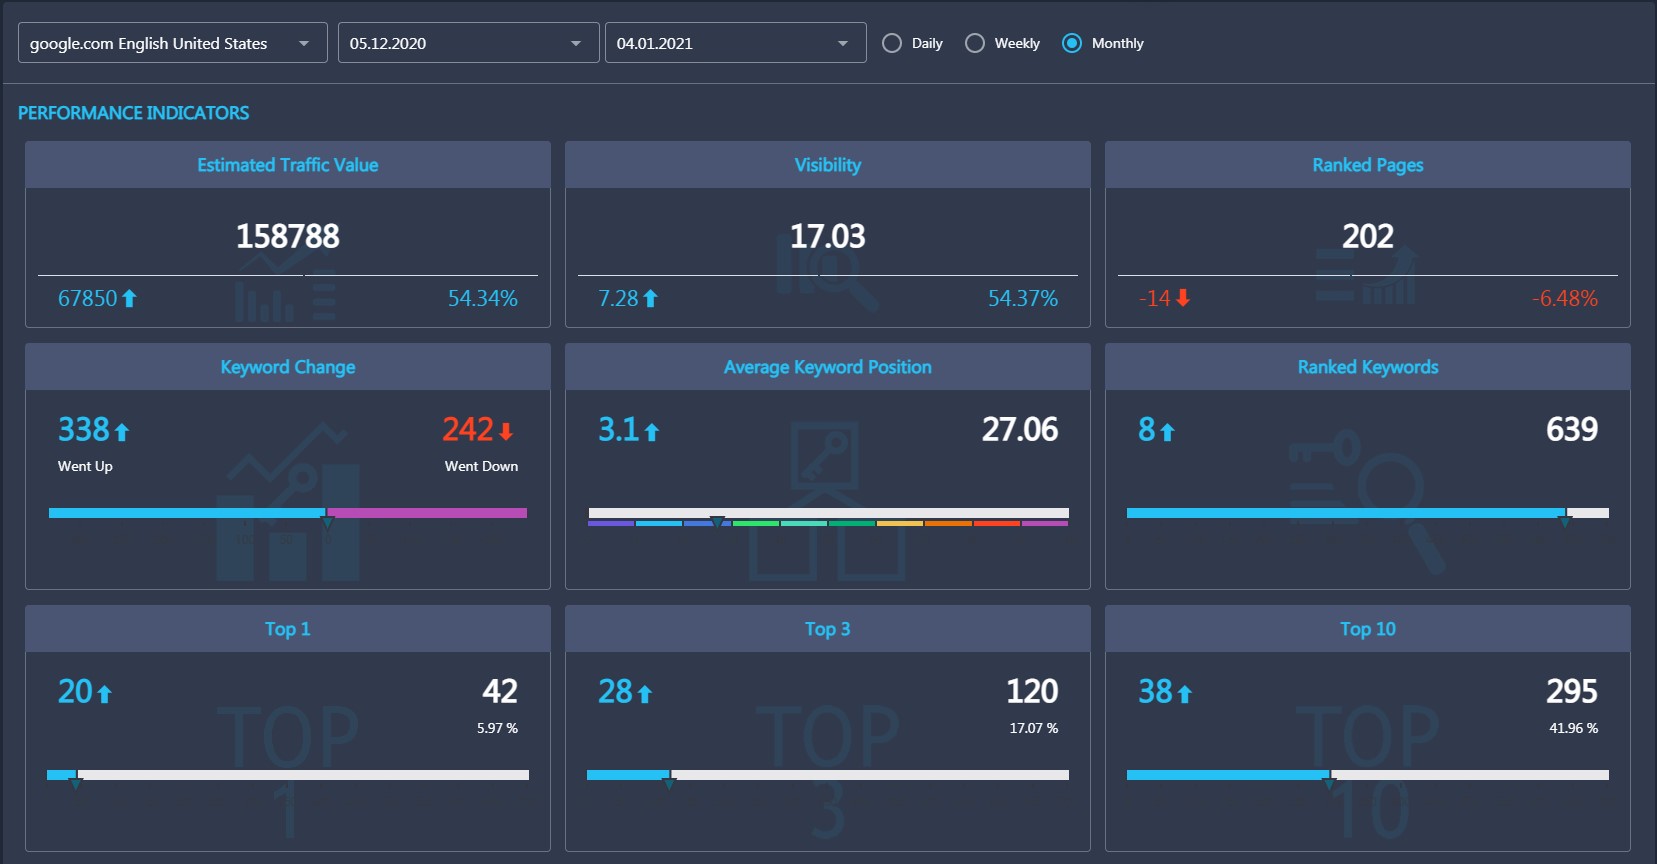
In the Performance Indicators section, you will find the following keyword metrics:
- ETV (Estimated Traffic Volume) is an estimation of website traffic based on keywords added to the project. The data difference is presented (quantity and percentage) under the value. The comparison is done between the initial and the end date of the specified period. Click here to learn how we calculate ETV.
- Visibility represents the total visibility value of a project based on keyword rankings. It is calculated by multiplying the distribution coefficient by 100%. Read this to learn how the distribution coefficient is defined. The data difference (quantity and percentage) are presented under the value. The comparison is done between the initial and the end date of the specified period.
- Ranked Pages refers to the number of unique pages relevant to the keywords in Top100. The data difference (quantity and percentage) are presented under the value. The comparison is done between the initial and the end date of the specified timeframe.
- Keyword Change shows the overall dynamics of keyword rankings, where the red line corresponds to keywords that went down and the blue one to keywords that went up. The comparison is done between the initial and the end date of the specified period.
- Average Keyword Position is an arithmetic mean for all keyword positions. Please note that keywords not included in Top100 take the value of 100 when calculating.
- Ranked Keywords refers to the number of keywords in the Top100. You can also check the data difference between the initial and the end date of the specifed timeframe.
- Top1, Top3, Top10 indicate the numbers of keywords in the corresponding Top. Under the quantitative value, the percentage share of all project keywords is displayed. On the left, the data difference is shown. The comparison occurs between the initial and the end date of the specified period.
Performance charts
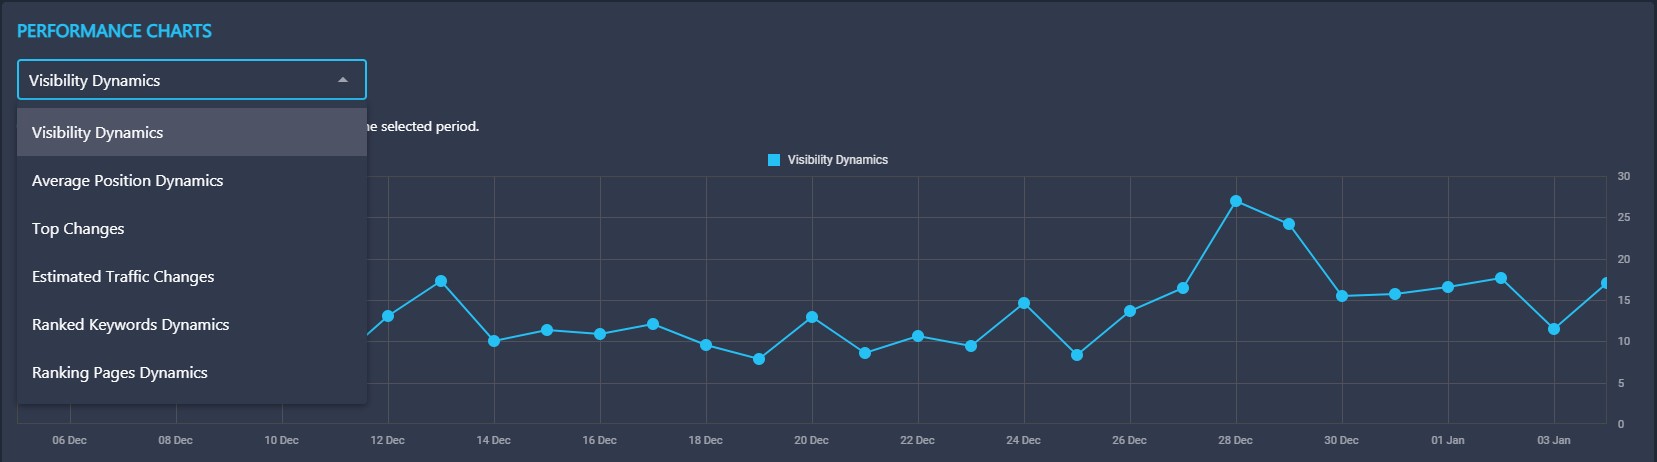
In this section, you can display the following graphs:
- Keyword dynamics in Tops indicates the numbers of keywords included in the corresponding TOP for each day of the specified timeframe.
- Visibility dynamics shows the changes in keyword visibility within the specified period.
- Average Position Dynamics displays the dynamics of average positions of project keywords.
- Estimated Traffic Value Dynamics provides information about the changes in the estimated amount of traffic based on keywords added to the project.
- Ranked Keywords Dynamics shows changes in the number of ranked keywords.
- Ranked Pages Dynamics shows the dynamics of changes in the number of ranked pages.