The Won / Lost section is designed to show you the number of keywords that have won, lost, and retained positions during the specified timeframe. It also displays additional info for every search term.
The section is divided into two parts: Won / Lost Keywords Overview Chart and Won / Lost Keywords Details.
Won / Lost Keywords Overview Chart
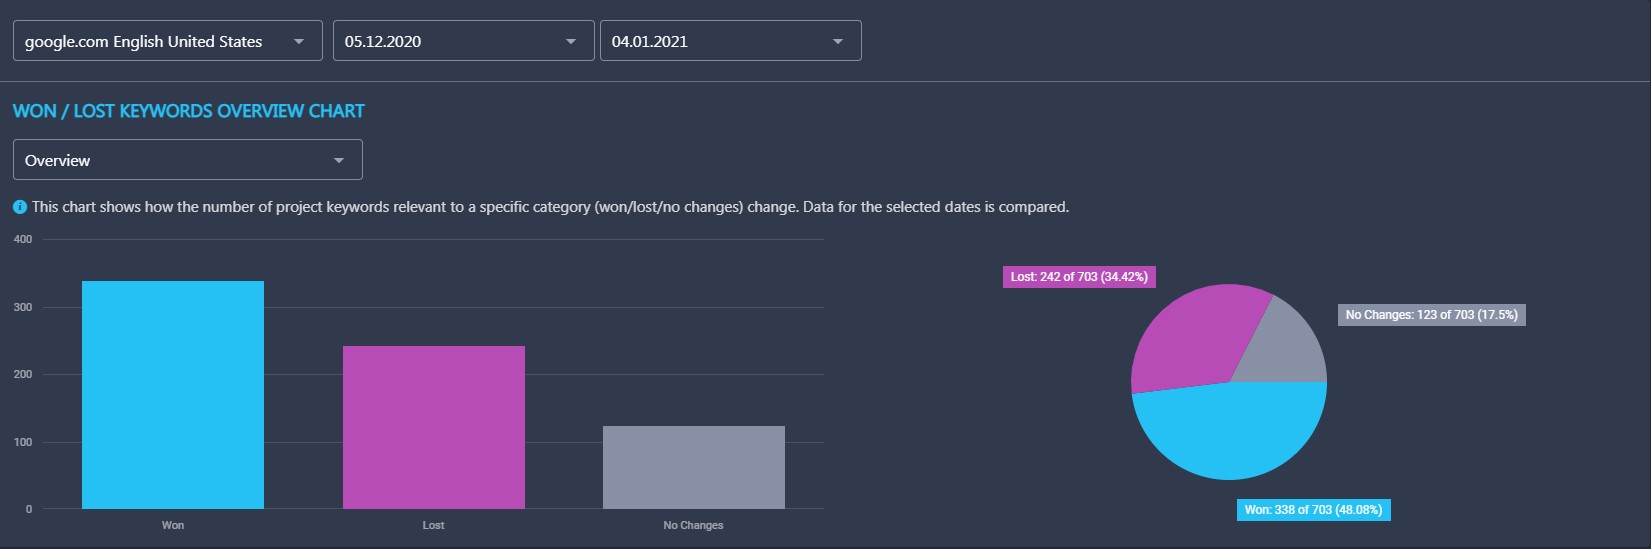
The Won / Lost Keywords Overview Chart is divided into two separate charts: Overview chart and Dynamics chart. The Overview chart displays the number of keywords that have won, lost, or retained positions during the specified period. It has three bars:
- The blue bar represents the number and percentage of keywords that went up compared to the initial date.
- The purple bar represents the number and percentage of keywords that went down compared to the initial date.
- The Grey bar represents the number and percentage of keywords that retained the same positions compared to the initial date.
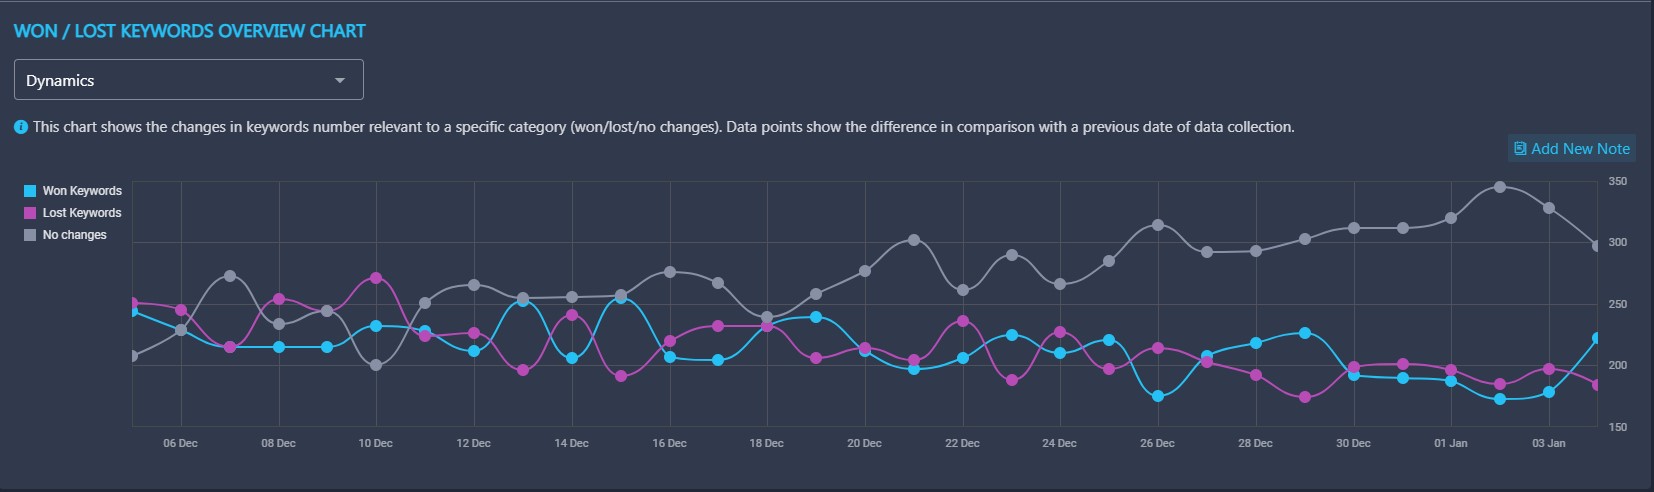
The Dynamics chart provides comprehensive information about the daily performance of your keywords. It will help you find the exact dates when your website experienced the most ranking fluctuations so that you can assume which SEO strategies have led to them.
Won / Lost Keywords Details
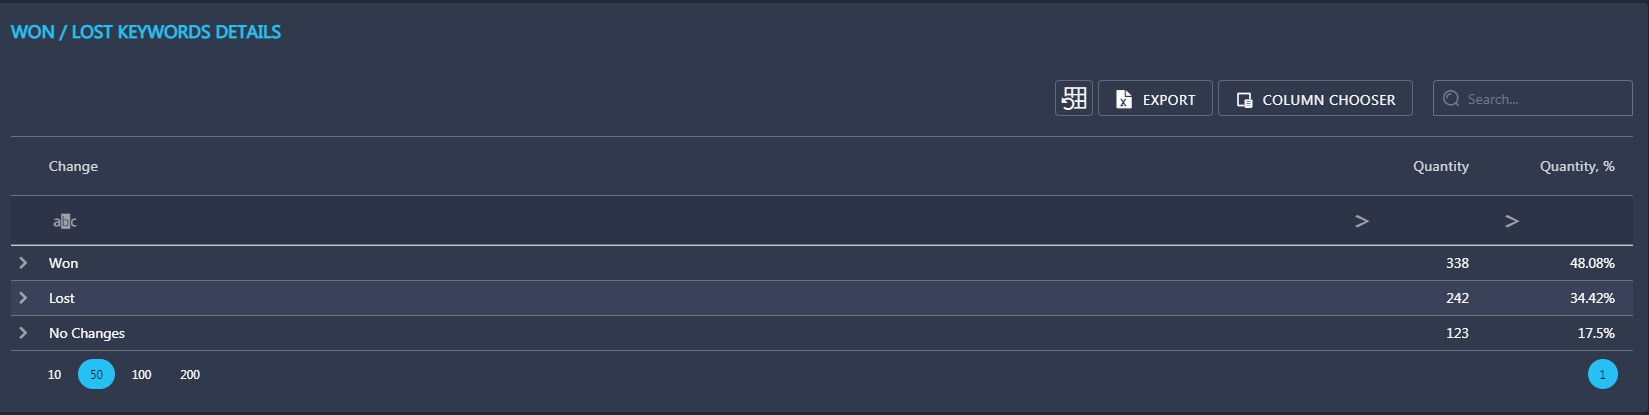
In the Won / Lost Keywords Details section, you can find additional information about your project keywords that have won, lost, and retained positions.
By clicking on the arrow near the category, you will get a drop-down list with detailed info on every keyword.

The tool will provide you with relevant pages, search volumes, current positions, and total results for every keyword added to the project. You can also open Column Chooser and add more metrics to the table (such as KEI, CPC, ETV, Competition, Traffic cost, and SERP Elements). To learn more about keyword metrics, read this.