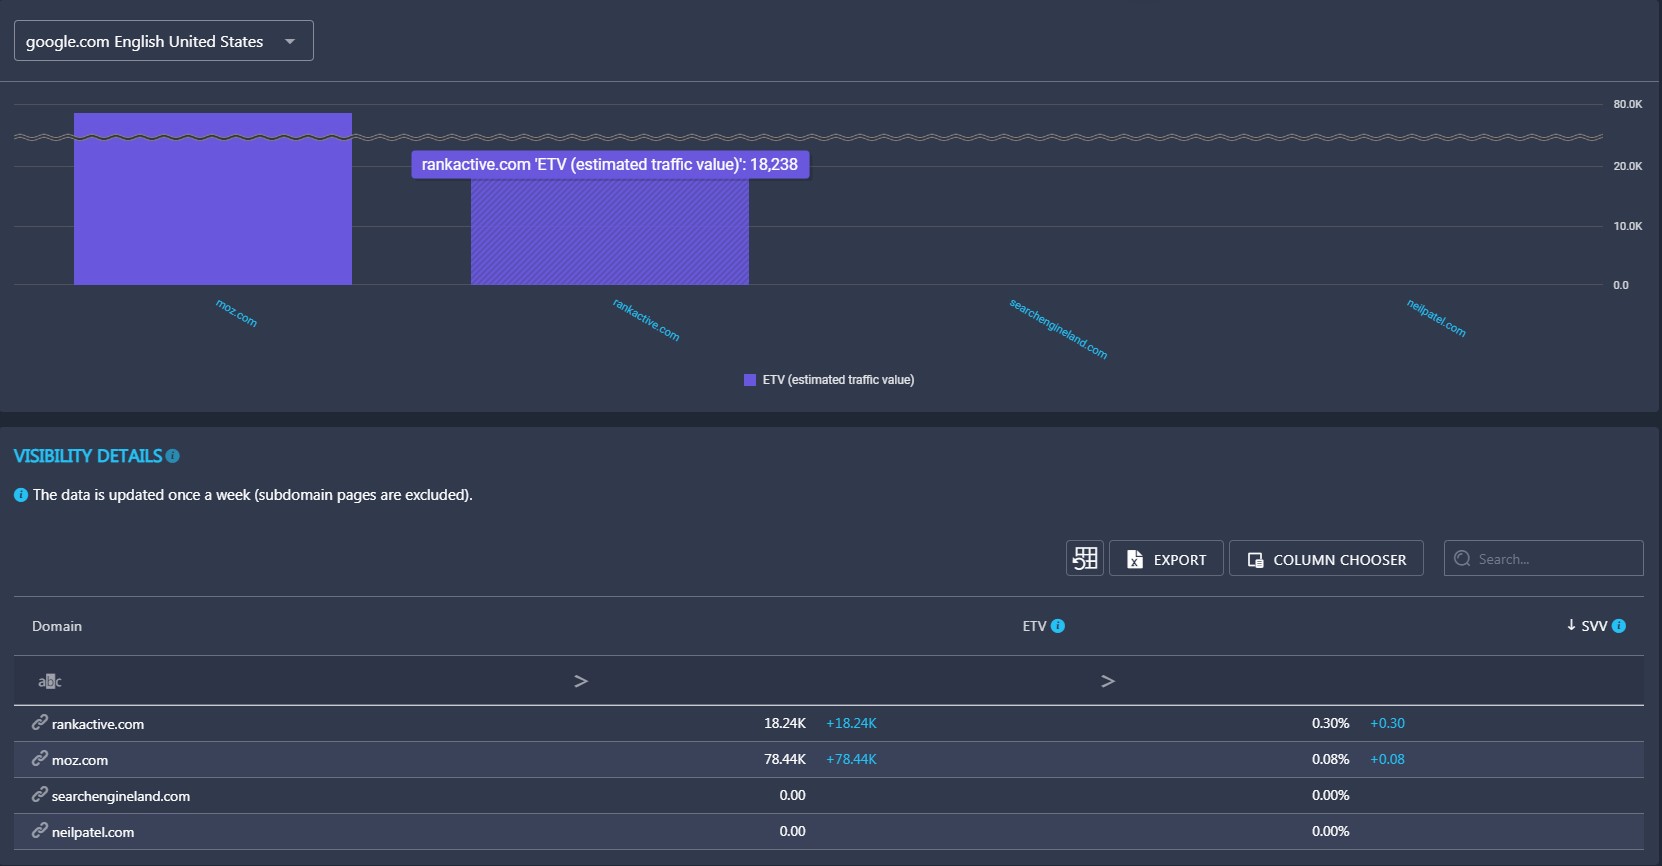
The Visibility section provides information about your and competitors’ website visibility. It is divided into two parts: the ETV graph and Visibility Details.
The ETV graph shows your and competitors’ estimated traffic values for project keywords. This metric refers to an estimation of website traffic that can be driven by all keywords added to the project. It is calculated by the following formula: search volume * traffic distribution rate.
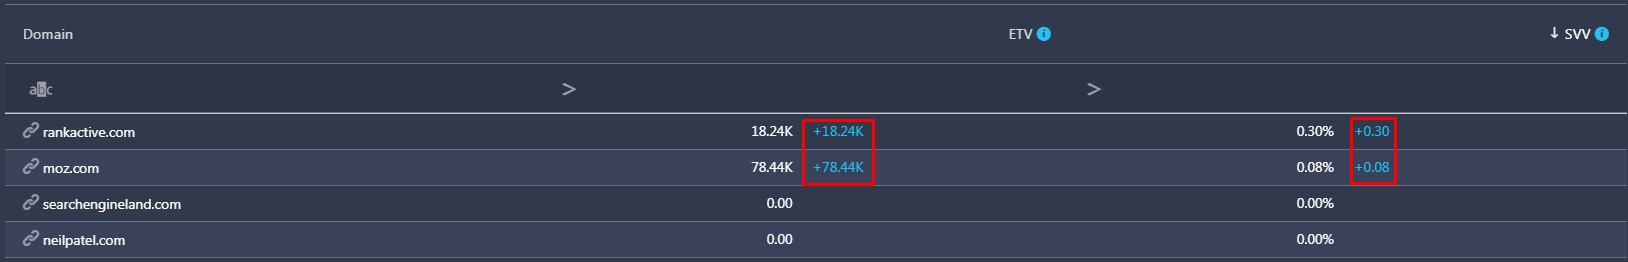
In the Visibility Details table, besides ETV, you can also find SVV (Search Visibility Value) for all project keywords. This metric represents the overall visibility of your and competitors’ keywords added to the project. The value is presented in percentage. It is calculated by the formula:

The distribution coefficient is defined by the following table:
| Top1 | 1 |
| Top2 | 0.9 |
| Top3 | 0.8 |
| Top4 | 0.7 |
| Top5 | 0.6 |
| Top6 | 0.5 |
| Top7 | 0.4 |
| Top8 | 0.3 |
| Top9 | 0.2 |
| Top10 | 0.1 |
| Top11-20 | 0.05 |
| Top21+ | 0 |
Along with ETVs and SVVs, you can see the delta of each value. It displays the weekly dynamics of growth or downfall of the indicators.
You can download the data from the table by clicking on the Export button.