A Non-Technical SEO Guide to Lighthouse Metrics
1 February 2021 Leave a comment ALL-HANDS SEO

Lighthouse is a useful SEO tool that evaluates the quality of websites by different metrics. It provides valuable tips on improving user experience on a page and can help you get a sense of how Google perceives your website. But there is one problem. All Lighthouse metrics are too technical, so most SEOs who aren’t into “technical stuff” can’t really understand them.
That’s why we decided to write this blog post and clear things up. It will guide you through various Lighthouse metrics and explain what they mean, why they’re so crucial, and how to improve your website’s score for them. We’ll try to be as clear as possible so that even non-technical SEOs can easily understand what Lighthouse metrics are all about.
What Lighthouse metrics mean and why they’re important
To get your website assessed by Lighthouse metrics, you need to run the tool first. You can do it either in Chrome DevTools or in RankActive. We find the latter option more convenient as we have all SEO tools in one place and provide more metrics than the original Lighthouse itself. For example, First CPU Idle, First Meaningful Paint, and many other metrics were deleted from the last Lighthouse version but are still available in RankActive.
Moreover, RankActive’s Lighthouse enables you to scan all website pages at once after generating an API key in the settings, while in Google’s Lighthouse, you can only scan pages one by one.
So let’s open RankActive’s version of Lighthouse and scan a random webpage.

All the metrics we need can be found in the Performance section of the tool. Lighthouse assesses webpages by the following parameters:
- First Contentful Paint and First Contentful Paint (3G).
- Speed Index.
- Largest Contentful Paint.
- Time to Interactive.
- Total Blocking Time.
- Cumulative Layout Shift.
- First CPU Idle.
- Max Potential First Input Delay.
- First Meaningful Paint.
- Estimated Input Latency.
Sounds like rocket science, doesn’t it? But it’s not. Let us explain what these metrics mean so you can actually start understanding them. But before we begin, you should know that page experience will soon become a ranking factor, so all these metrics are equally important for SEO, and you shouldn’t underestimate them.
If that’s OK with you, we can start explaining them. To make the material easier to read, we’ll divide all the metrics into two categories: content metrics and page responsiveness metrics.
Content metrics
Lighthouse content metrics can help you understand what experience your visitors get with the content of your webpages. There are currently six content metrics available in RankActive’s Lighthouse: First Contentful Paint, First Contentful Paint (3G), Largest Contentful Paint, First Meaningful Paint, Speed Index, and Cumulative Layout Shift. Let’s learn more about each one of them.
1. First Contentful Paint (FCP) and First Contentful Paint (3G)
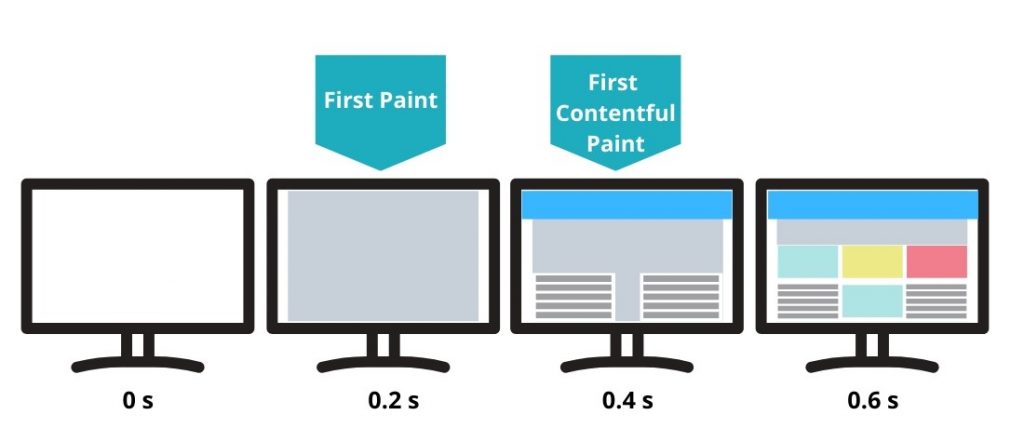
First Contentful Paint (FCP) measures the time a webpage takes to display any part of its content on the screen. The term “content” includes text, images (as well as background images), and several graphic elements.
Here is how First Contentful Paint looks on the example of YouTube.
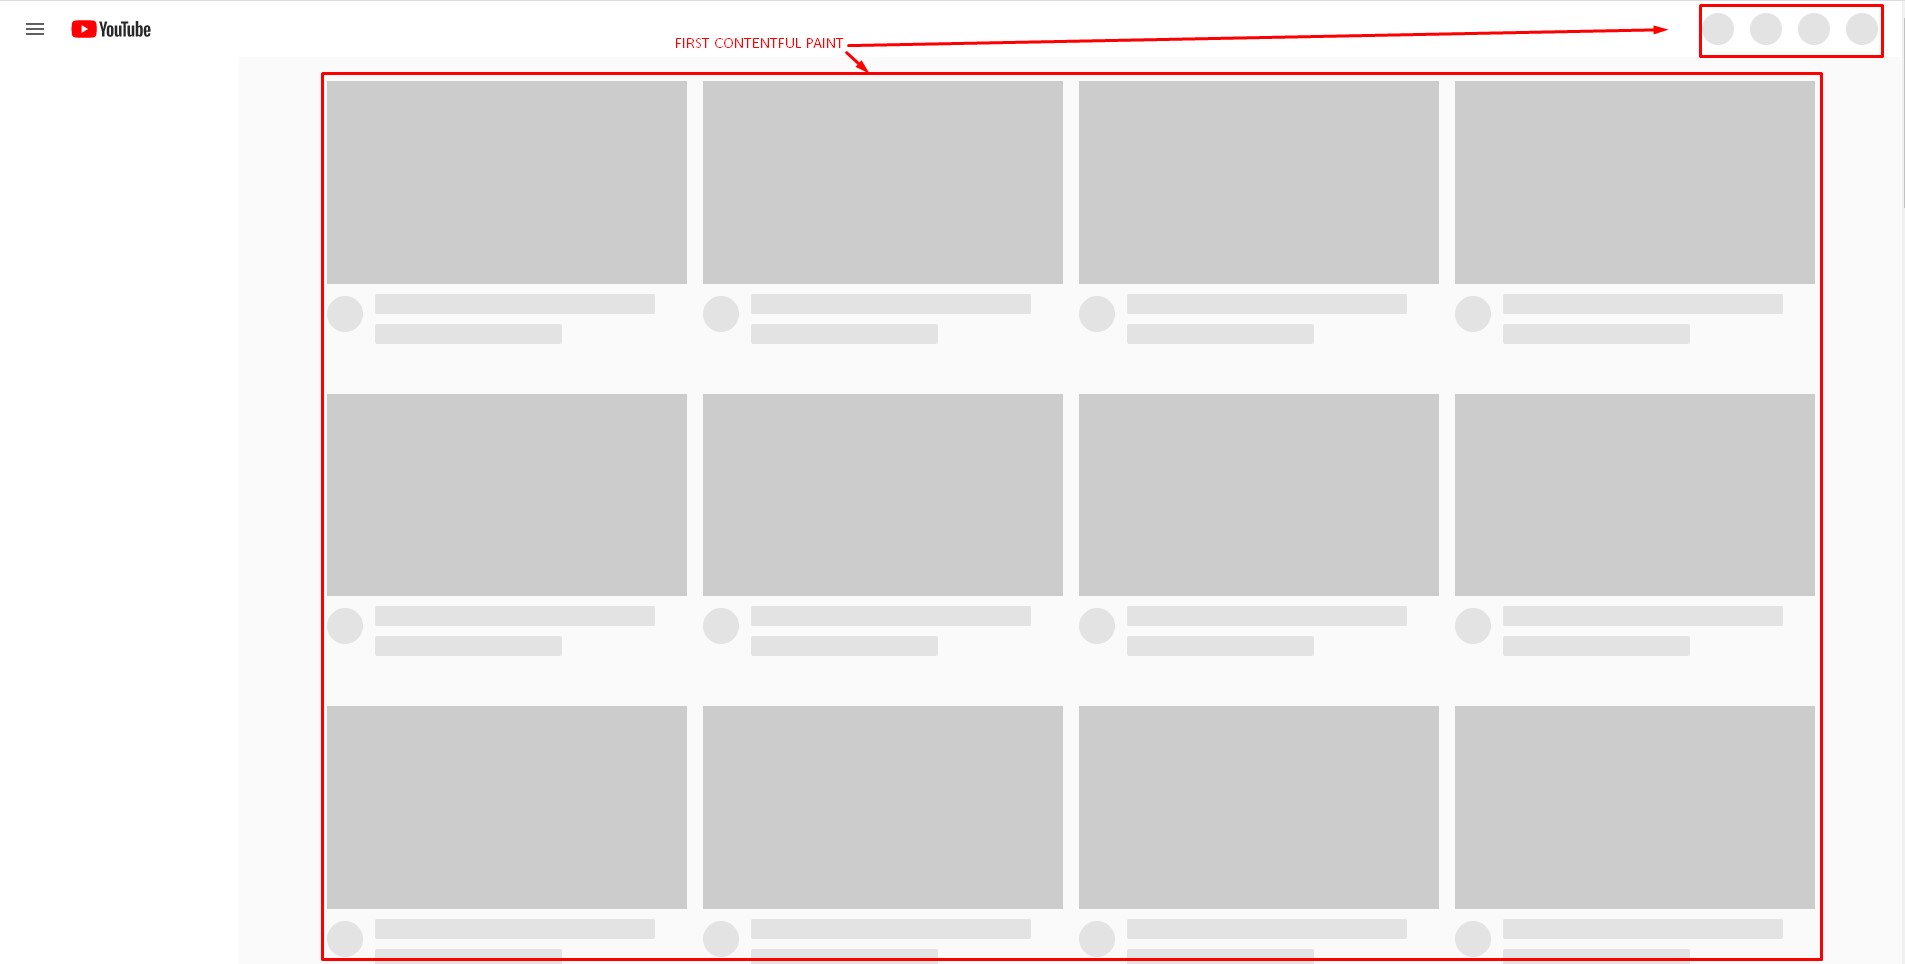
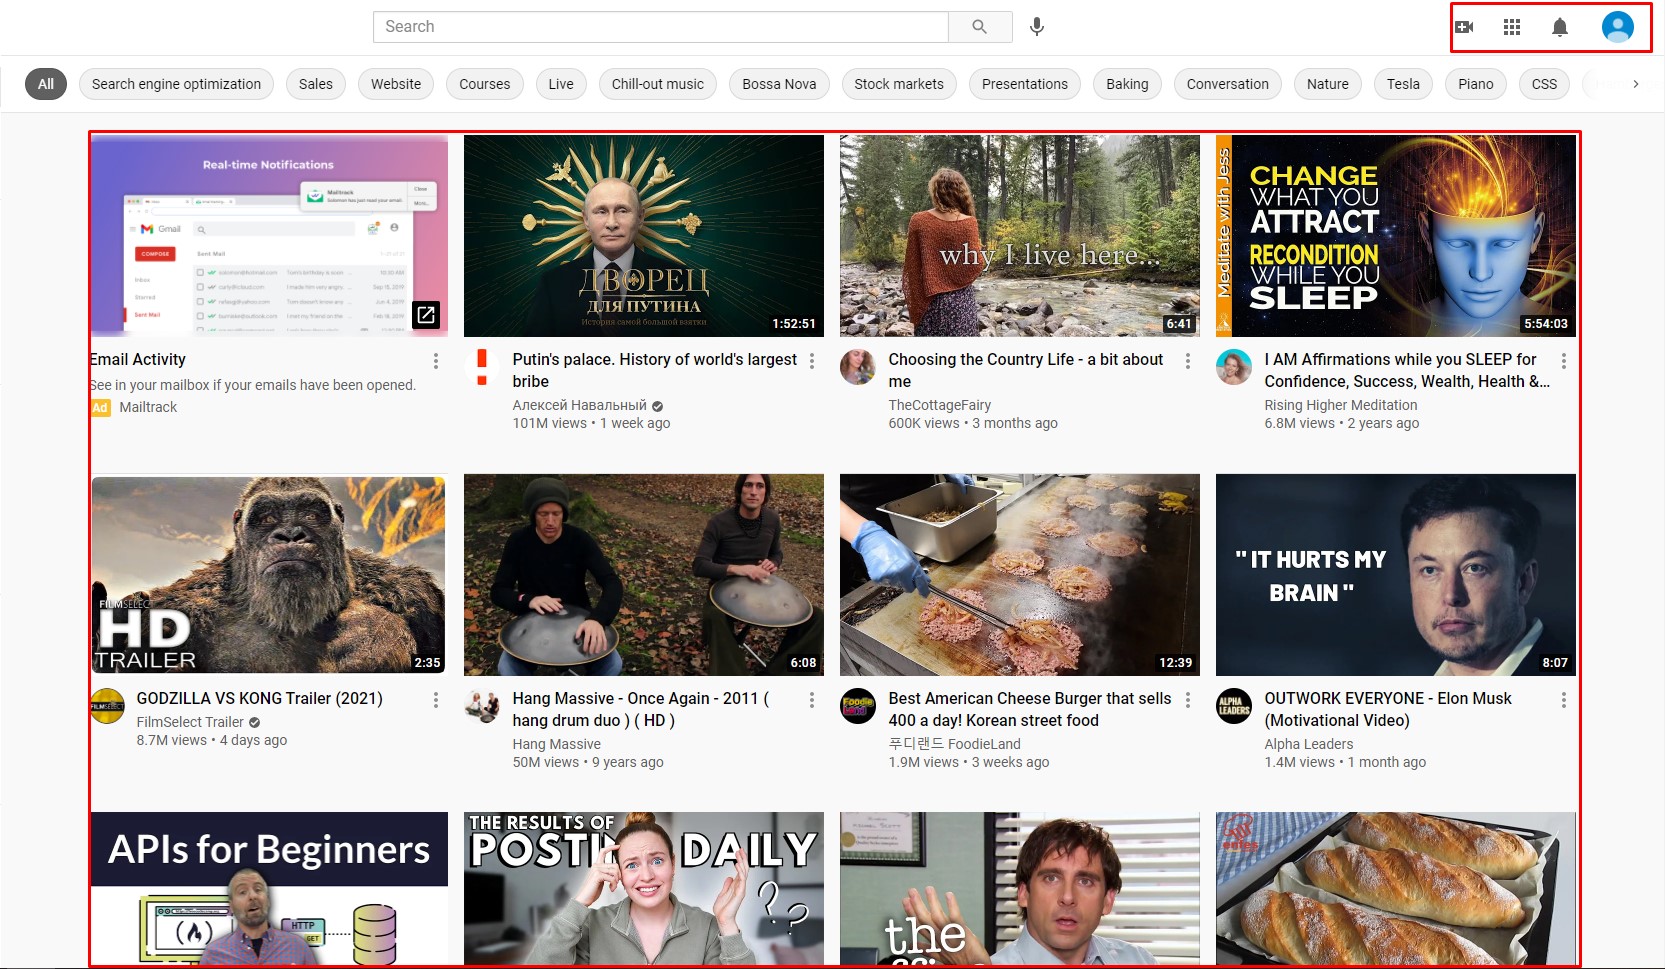
As you can see in the screenshot, in YouTube’s case, the First Contentful Paint is when the page layout elements are painted. After that, these elements will turn into videos and navigation buttons.
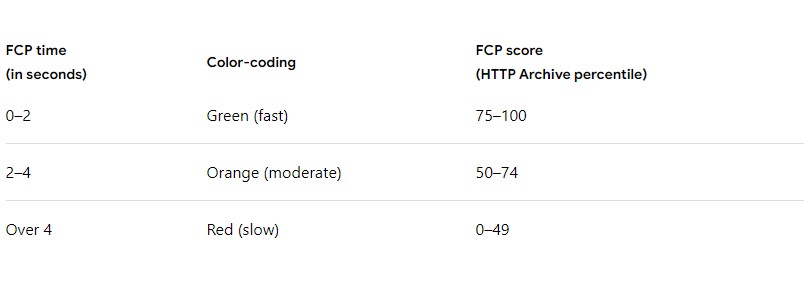
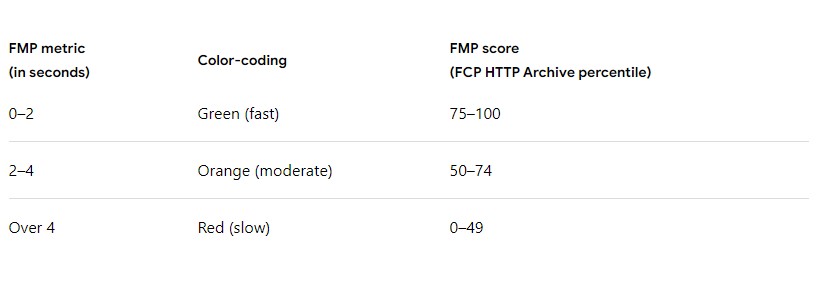
The faster any part of page content is painted, the better for the end-user and the higher score you’ll get. Ideally, it should be painted within 0 – 2 seconds.
First Contentful Paint (3G) is exactly the same as First Contentful Paint. The only difference is that First Contentful Paint (3G) measures the time a webpage takes to display any part of its content on the screen on the 3G network. By default, Lighthouse emulates a slow 4G connection.
Why First Contentful Paint is important
Having fast First Contentful Paint is important because it helps reassure a user that something is happening. If the first part of page content takes too long to load, users may assume that the page is broken and leave it before any content loads. That way, you’ll lose potential customers or blog readers.
While keeping your FCP fast, you should also care about Largest Contentful Paint. As you’ll learn right now, this metric is equally important.
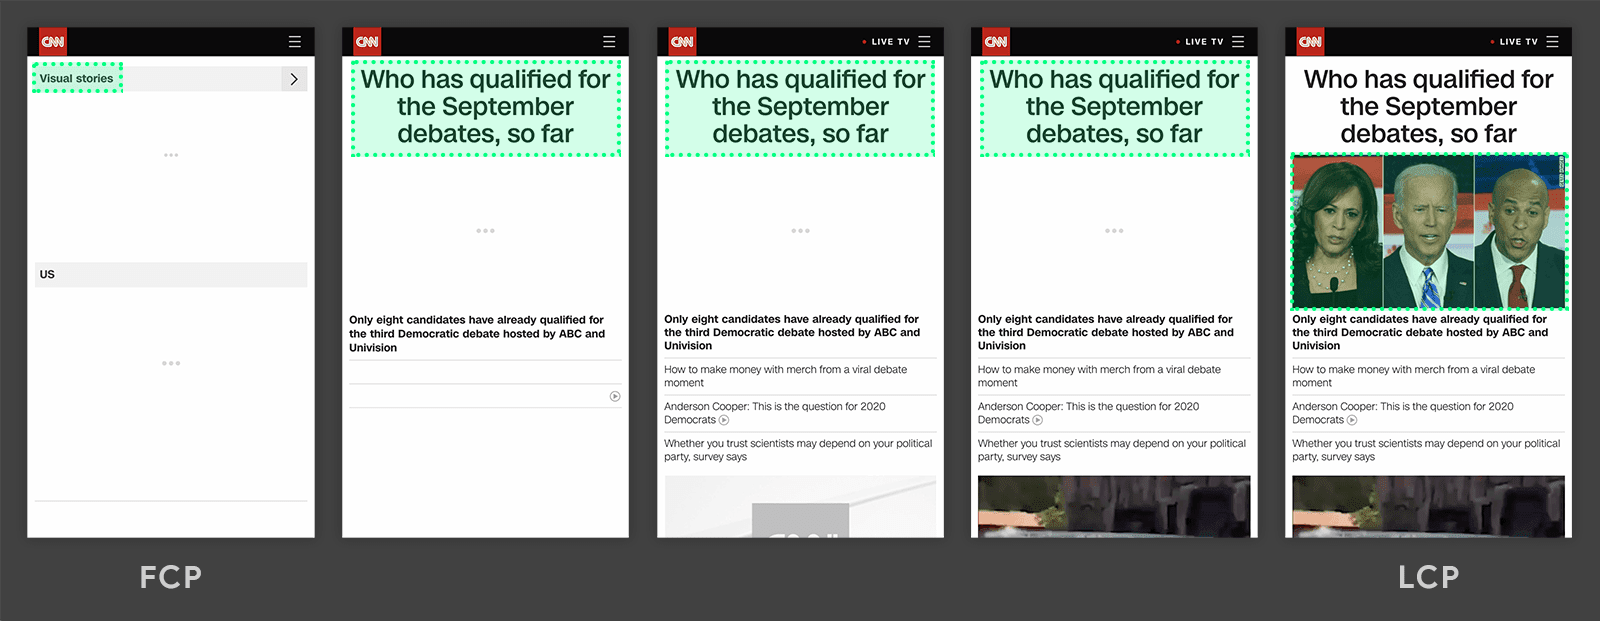
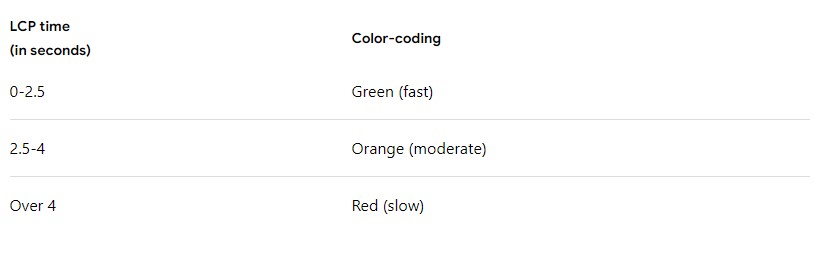
Largest Contentful Paint (LCP) measures the time a webpage takes to display the largest above the fold content element on the screen. The “above the fold” term suggests content available without scrolling. To calculate LCP, Google first identifies the largest content element on the page: for example, if you have a header image that is larger than a header text, Google will consider the header image as the largest content element.
Ideally, the largest content element should be displayed within 0 – 2,5 seconds.
Why Largest Contentful Paint is important
Fast LCP helps reassure website visitors that the given page is useful. By glancing at the page’s largest content element, they can assume what the page is about and decide whether to stay or leave. Thus, if the largest content element takes too long to load, visitors can’t estimate the page’s value at a glance, so they may lose their patience and bounce back to search results.
Moreover, Largest Contentful Paint is also part of Core Web Vitrals metrics, which will soon be used by Google to determine website rankings. That’s why you should keep your pages’ LCP as low as you can.
When it comes to Largest Contentful Paint, many SEOs confuse it with First Meaningful Paint. However, these metrics are different.
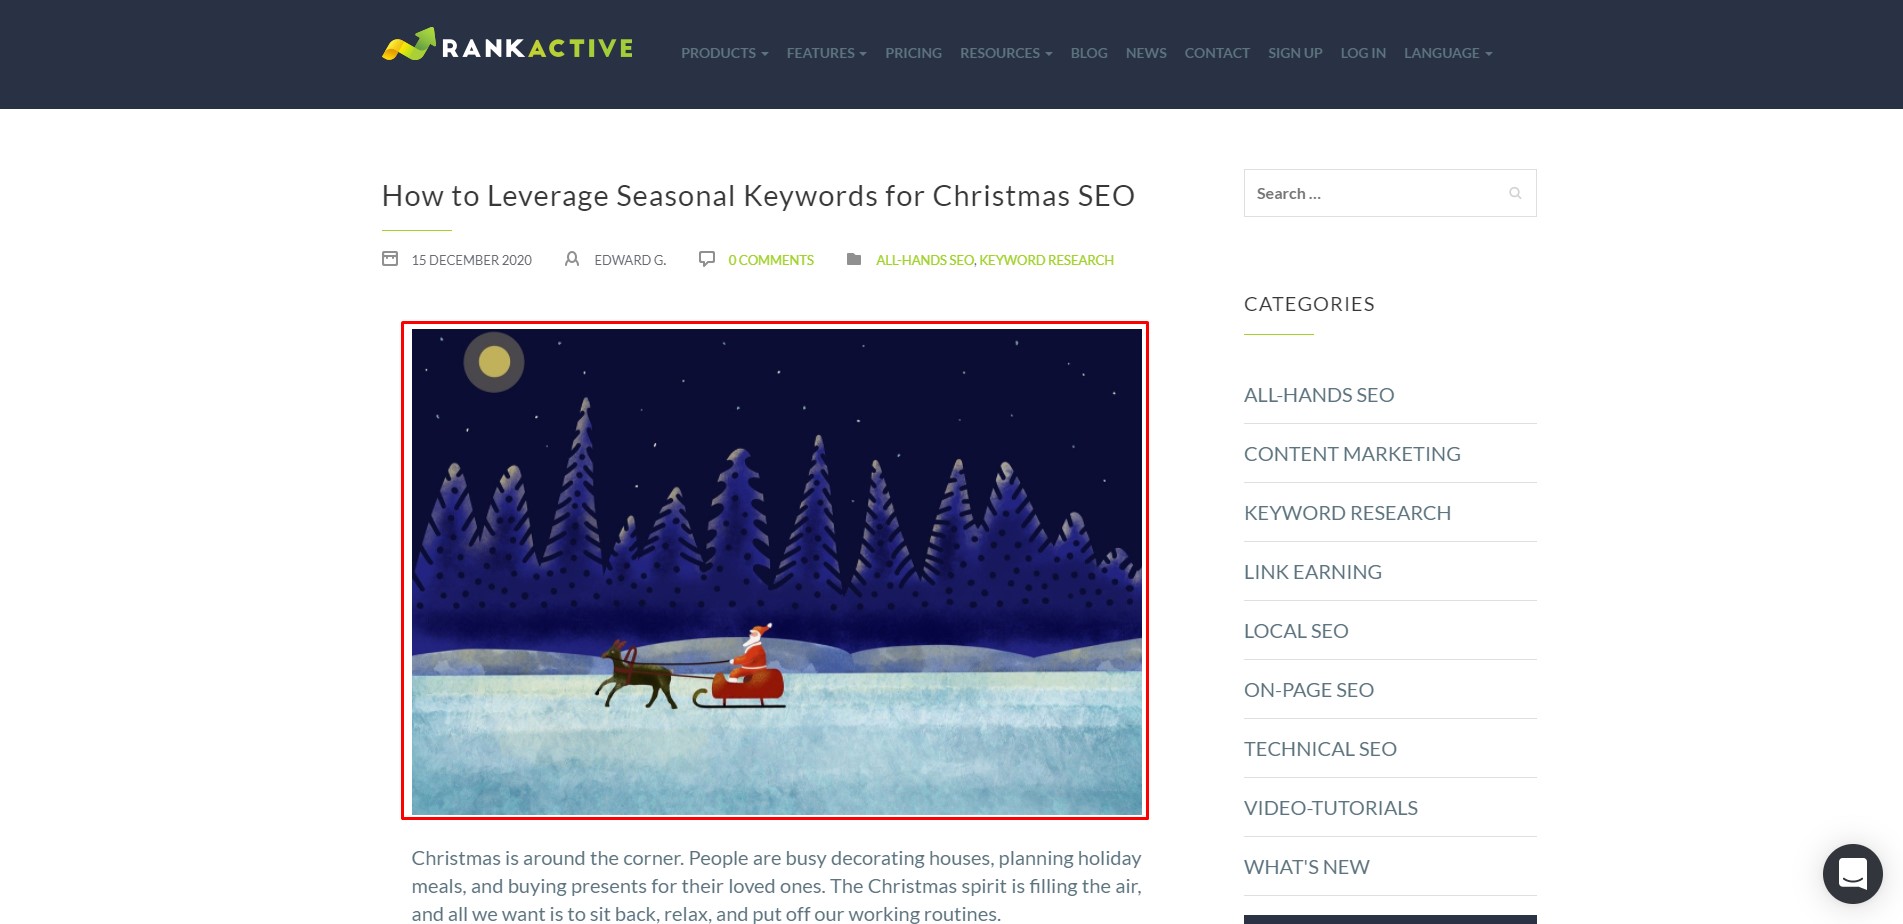
First Meaningful Paint measures the amount of time it takes a webpage to display its primary above the fold content. This metric is similar to Largest Contentful Paint, but they have the difference. As you’ve learned, Largest Contentful Paint marks the time when the largest above the fold content element is loaded, while First Meaningful Paint marks the time when all above the fold content is loaded.
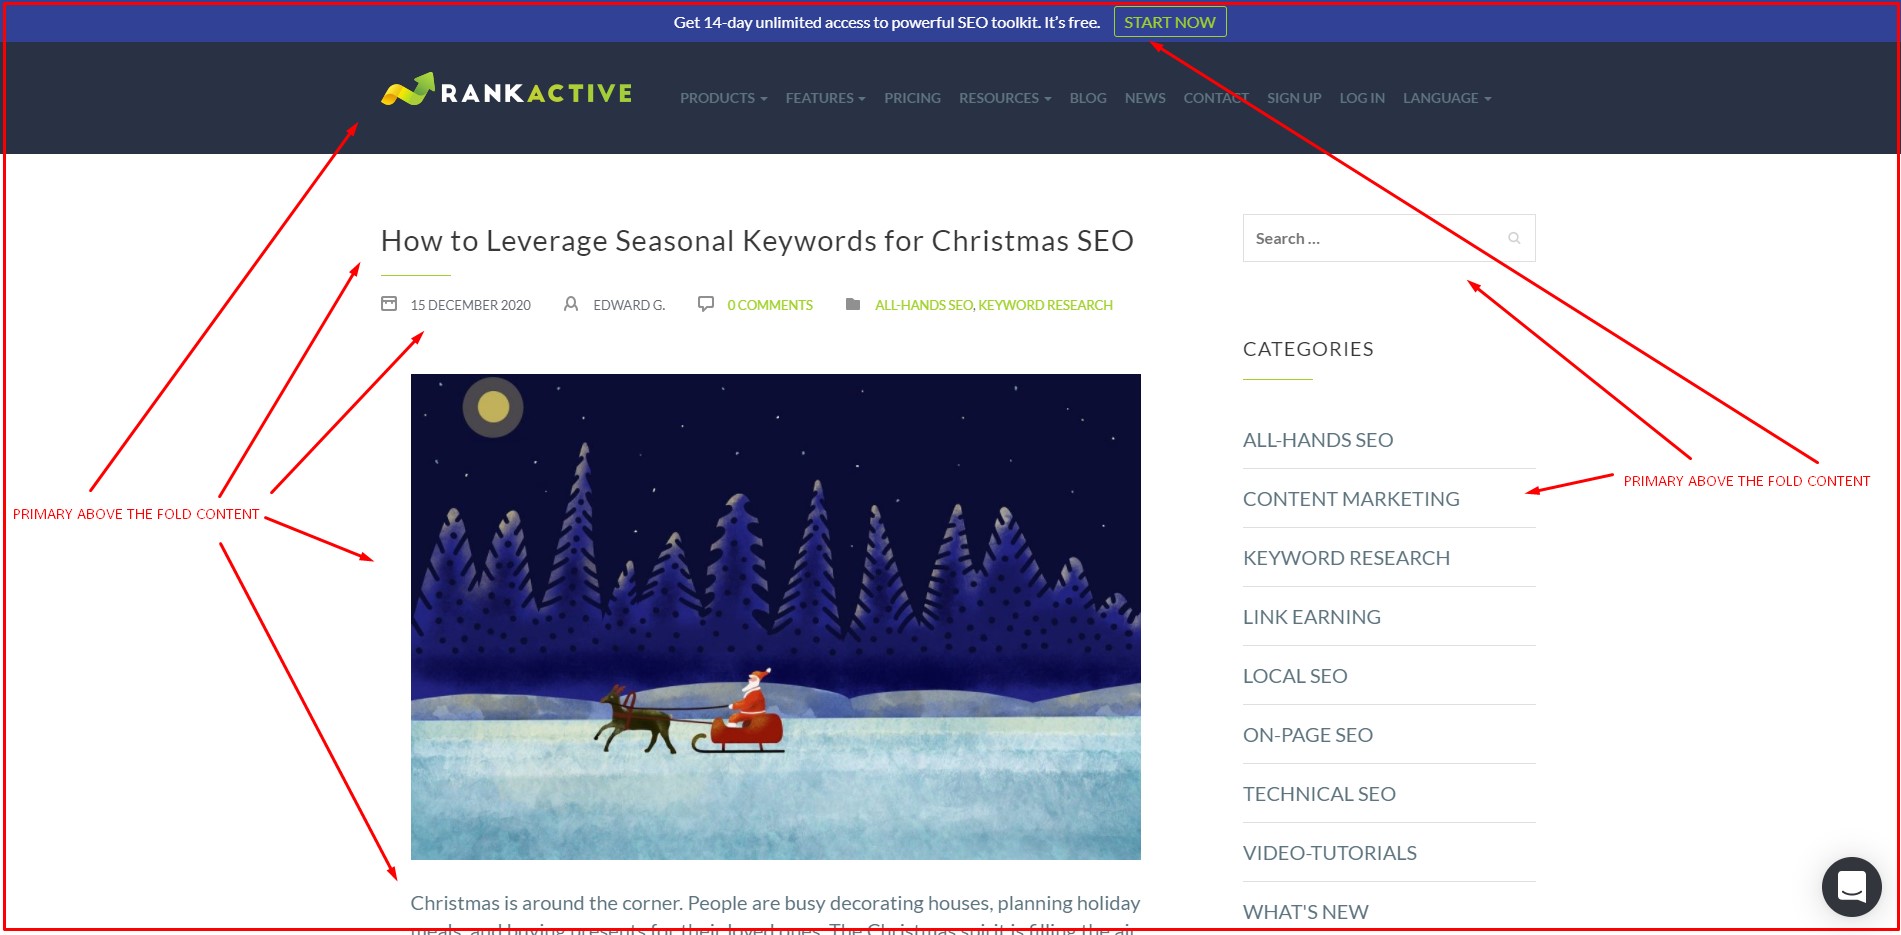
Ideally, your webpage’s primary content should be painted within 0 — 2 seconds.
Why First Meaningful Paint is important
Just like Largest Contentful Paint, fast First Meaningful Paint helps reassure website visitors that the given page is useful. By glancing at the page’s primary content, they can quickly evaluate the page and decide whether to stay or leave. When primary content takes too long to load, visitors can’t estimate the page’s value at a glance, so they may leave it and visit another website in SERP.
Slow First Meaningful Paint speed is bad for UX, so it’s safe to say it’s also bad for your website’s rankings. And you know what else is bad for your rankings? A slow load speed of visible content. That brings us to another Lighthouse metric called Speed Index.
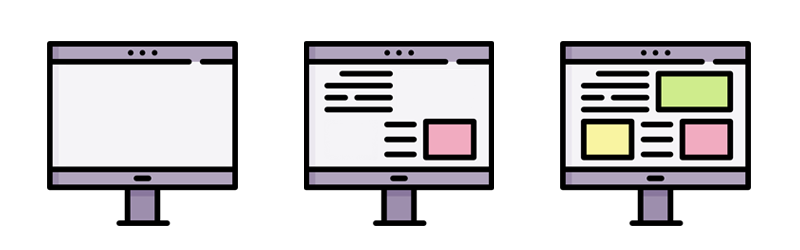
Speed Index measures the time it takes for the visible above the fold content to appear to users. Speed Index can help you compare performance against competitors or previous versions of the same website. Ideally, visible parts of content should be available within 0 — 4,3 seconds.

Why Speed Index is important
When there were no speed index measurements, you could only measure websites’ total load times. However, the total load time is quite a vague metric as it doesn’t represent the end-user experience correctly.
You see, most users are interested in the visible parts of your website. Even if the whole page takes long to load, this won’t damage user experience as long as the visible parts of the content are loaded and can be interacted with. When users see that the above-the-fold content is loaded (even if the remaining content is still loading), the page feels faster. So by keeping your website’s Speed Index as low as possible, you’ll ensure good UX for its visitors. And as we mentioned above, a good user experience will soon be crucial for rankings.
After making your visible content load fast enough, you should also ensure that it’s stable. The visual stability of your content can be evaluated by the Cumulative Layout Shift metric.
Cumulative Layout Shift (CLS) measures the movement of visible elements within the viewport. In other words, this metric is created to estimate the visual stability of webpage content. The calculation is based on the Impact Fraction and Distance Fraction metrics.
The first metric measures how unstable elements impact the viewport area between two frames, while the second one measures the distance that unstable elements have moved relative to the viewport. If you want to learn more about how CLS is calculated, read this article.
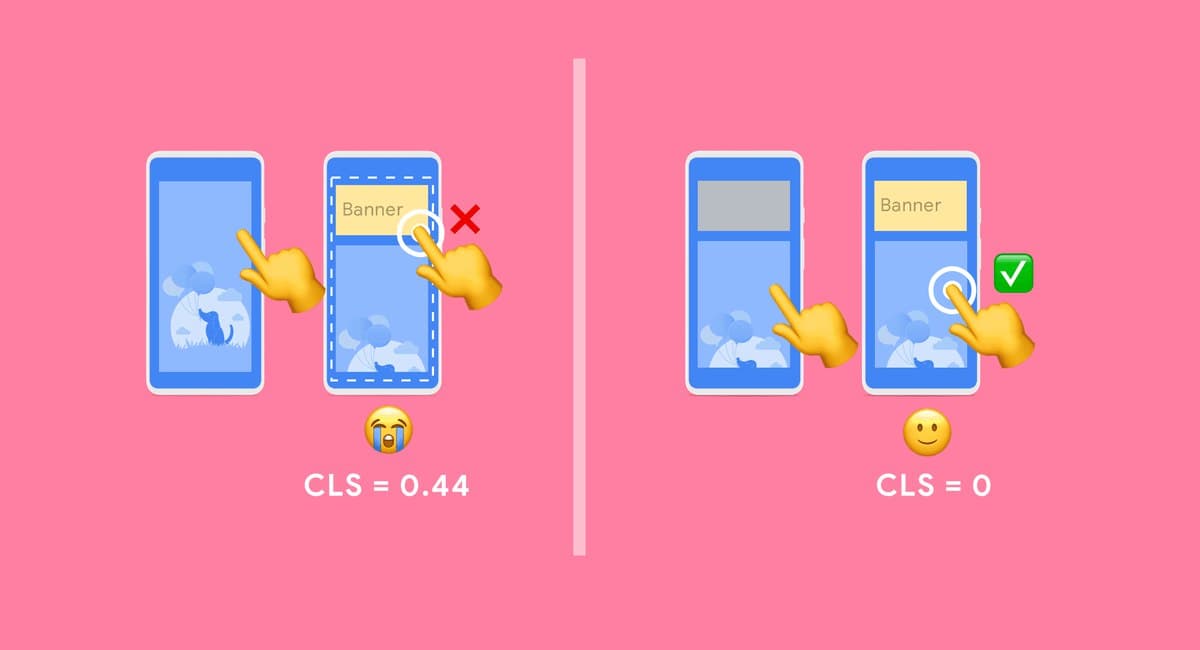
Low Cumulative Layout Shift score may be caused by banners, pop-up windows, images that take too long to load, and other page elements. It doesn’t mean you shouldn’t use these elements: it means you should make sure they load fast enough not to cause sudden page movements.
As you can see in the screenshot above, a small popup suddenly loaded and moved content down. It irritates users, so make sure you don’t have such content movements on your website.
To provide a good user experience, you should strive to have a CLS score of less than 0.1.

Why Cumulative Layout Shift is important
Having a low CLS score is crucial because nobody likes sudden movements of content. Just imagine yourself reading some exciting article on the internet when the page suddenly moves so that you lose your place. It probably has happened to you at least once, so you should know how irritating it is.
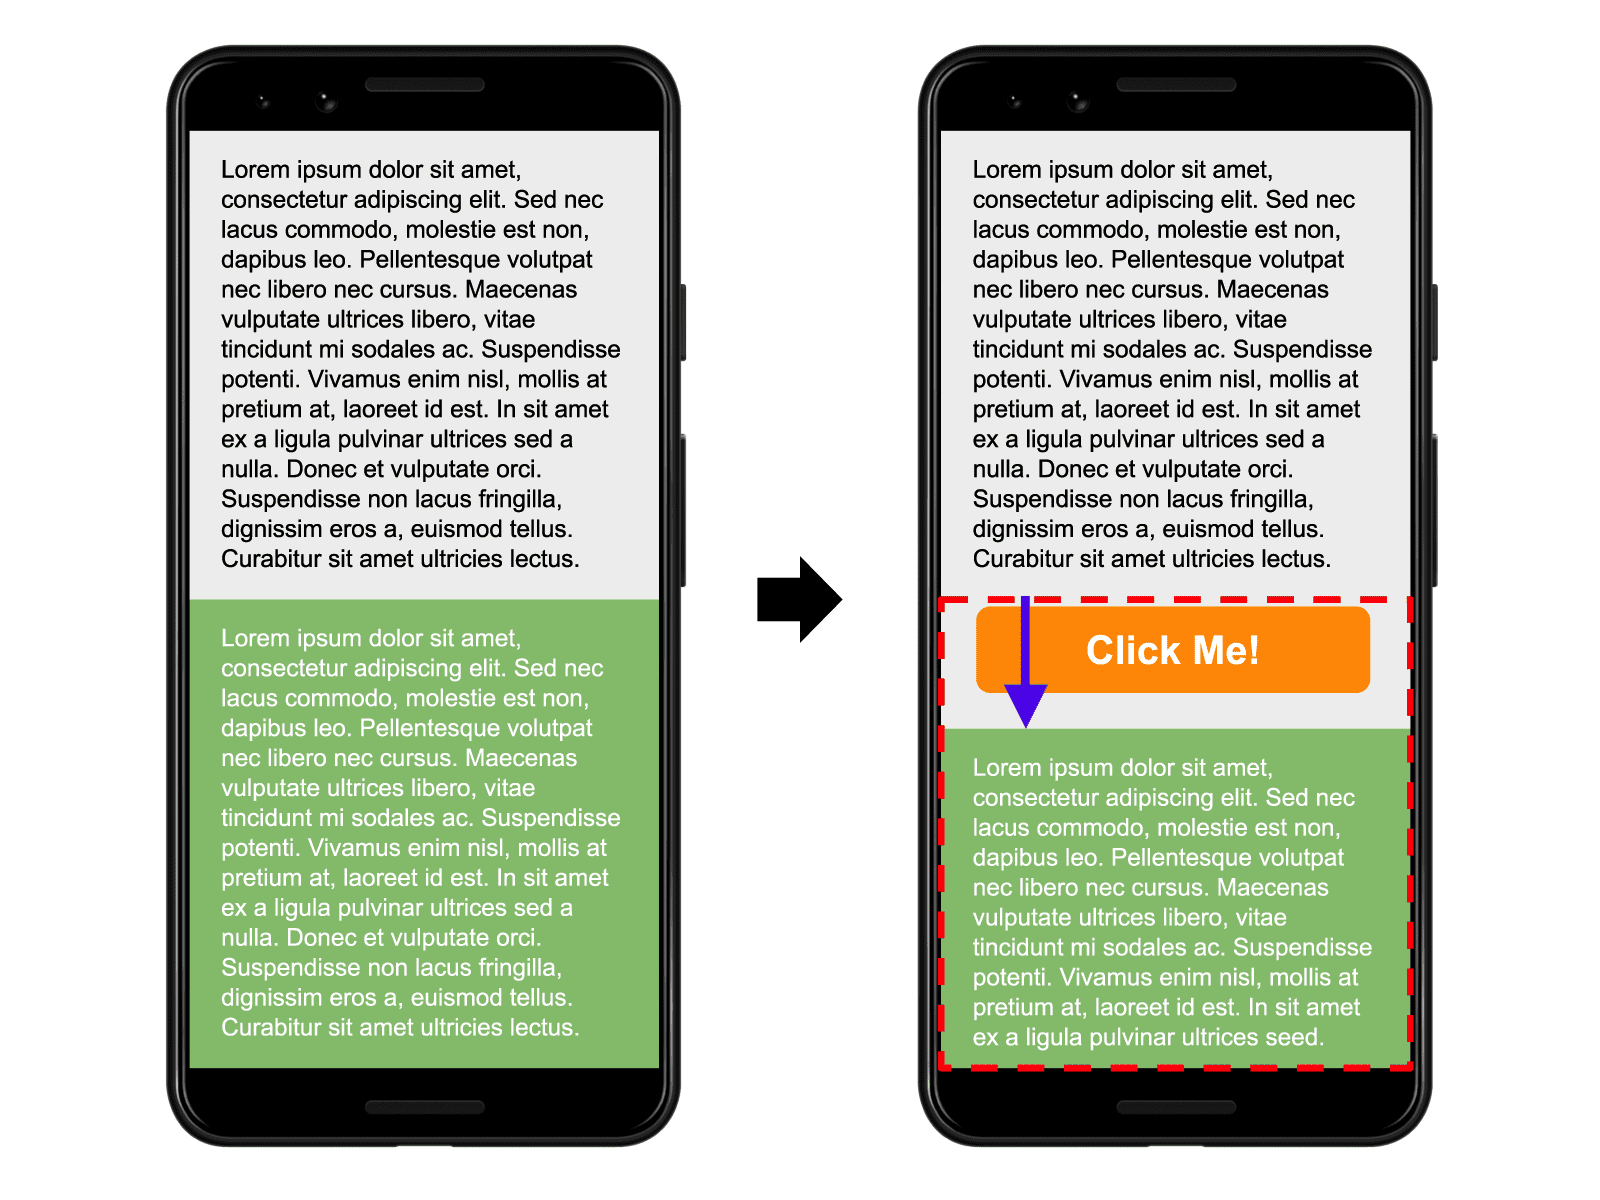
It’s even worse when content moves on e-commerce websites. It may cause issues like this:
Such an experience is frustrating, and Google is aware of that. That’s why it included Cumulative Layout Shift to its Core Web Vitals metrics. And as you already know, Google will soon start ranking websites based on their Core Web Vitals scores. Thus, you should do your best to lower your CLS score and keep it below 0.1 points.
But having content stable and load fast isn’t enough. You should also ensure it becomes interactive in a reasonable time. That brings us to various page responsiveness metrics.
Page responsiveness metrics
Lighthouse page responsiveness metrics can help you estimate how fast your webpages become responsive to the user input. In RankActive’s version of Lighthouse, you can find five page responsiveness metrics: Time To Interactive, First CPU Idle, Total Blocking Time, Max Potential First Input Delay, and Estimated Input Latency. Let us explain what they mean.

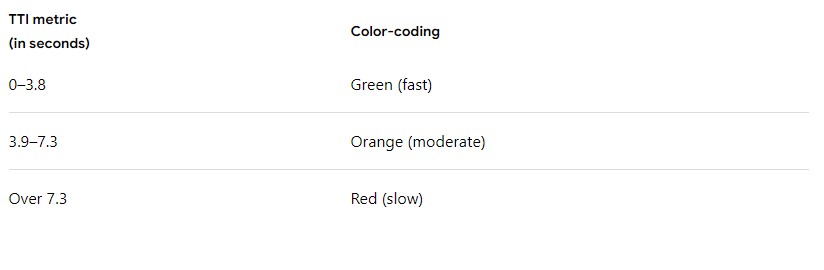
Time To Interactive measures the time it takes a webpage to become fully interactive. A page is considered fully interactive when it displays useful content and responds to user interactions within 50 milliseconds.
Let us explain.
Suppose you have a webpage with four interactive elements (say, clickable buttons). The Lighthouse bot will be clicking on those buttons and measuring how fast they respond to the input. If at least one button responds for longer than 50 milliseconds, the bot will consider the page as not fully interactive. Then it will repeat the same process until all four buttons respond within 50 milliseconds. When it happens, the bot will consider the page fully interactive.
So the Time To Interactive metric will display how long it took all four buttons to become interactive.
Ideally, your page should become fully interactive within 0 – 3,8 seconds.
Why Time To Interactive is important
Some webmasters optimize content visibility at the expense of interactivity. This creates a frustrating user experience: the webpage appears to be ready, but when a user tries to interact with it, nothing happens. As a result, they may assume the page is broken and leave it, causing higher bounce rates. That’s why you should pay attention to the Time To Interactive metric and make sure your webpages become interactive almost as fast as their main content becomes visible.
You also should ensure your webpages become minimally interactive fast enough. The next metric is designed to measure it.
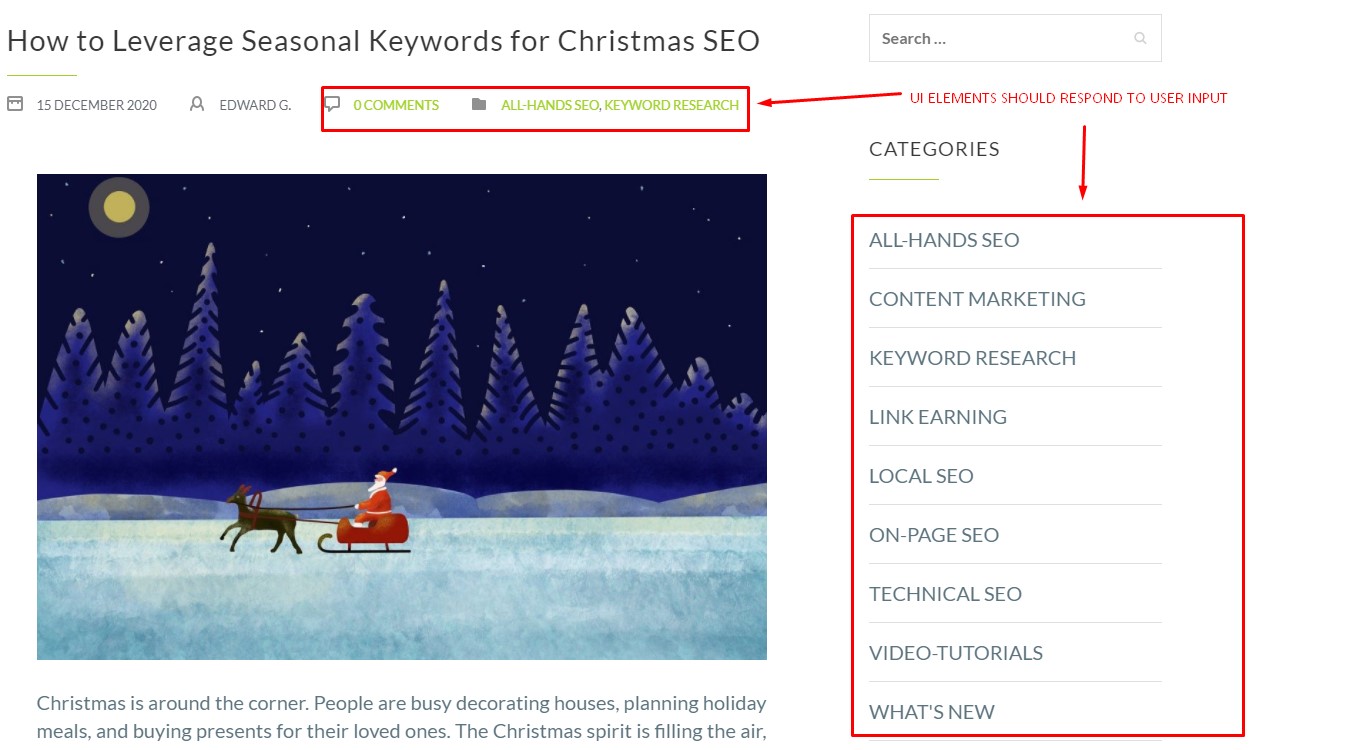
First CPU Idle measures the time it takes a webpage to become minimally interactive. You can call a page minimally interactive if most (but not all) of its UI elements on the screen are interactive and a page responds to user input in a reasonable time.
Let’s get back to our “buttons” example. So if three buttons respond to the input within 50 milliseconds, while one responds longer, the Lighthouse auditing bot will consider the page minimally interactive.
To get the highest score, your webpage should become minimally interactive between 0 and 4,7 seconds.

Why First CPU Idle is important
As you can see, First CPU Idle is quite similar to Time To Interactive, and that’s pretty much the reason this metric was deleted from Lighthouse V6. Yet, RankActive’s version of Lighthouse still tracks this metric, so you can learn how fast your webpages become minimally interactive by using our tool.
We have already explained why Time To Interactive is important. First CPU Idle is important for the same reasons. When content loads faster than the page becomes interactive, it may confuse your visitors so that they may assume the page is broken and leave it. That’s why you should keep your webpages’ First CPU Idle as low as you can.
While doing it, you should also pay attention to how long your pages are blocked from any user input. The next metric can help you estimate it.
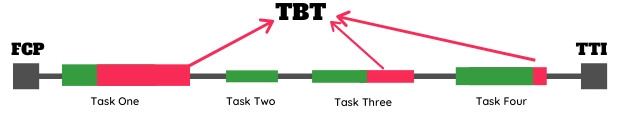
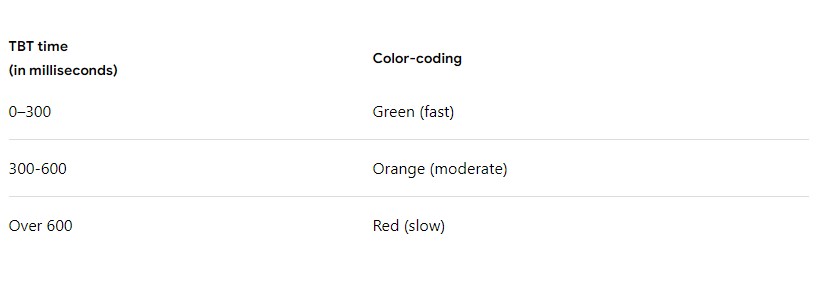
Total Blocking Time (TBT) measures the total amount of time a webpage is blocked from responding to user input (mouse clicks, screen taps, or button presses). The sum is calculated by adding blocking portions of all long tasks between First Contentful Paint and Time to Interactive.
It may be hard to follow, so let us explain.
Tasks are any user actions on a page. A long task is a task that runs for more than 50 ms, while a blocking portion is the amount of time after 50 ms. For example, if Lighthouse detects a 90 ms long task, the blocking portion will be 40 ms. So when Lighthouse scans your webpage, it emulates user actions on it and estimates how long it stays unresponsive. After that, it adds blocking portions of all long tasks and displays the amount of time for which the page is unresponsive.
Ideally, Total Blocking Time on your webpages should be less than 0.3 seconds.
Why TBT is important
The main thread is responsible for rendering (visualizing) a page. Long tasks block the main thread. While long tasks are running, a browser can’t interrupt them even in case of user input. By default, all JavaScripts are running on the main thread: given that a browser can’t interrupt a running task, a long JS function can block the main thread entirely, causing the page to become unresponsive. As a result, users will have to wait before a page produces results for their input.
And as you probably know, users hate waiting.
The higher the Total Blocking Time of your page, the more its visitors will have to wait for it to produce results for their input. And the more they will have to wait for it, the higher the chance of leaving your page. That’s why you should strive to keep TBT as low as you possibly can.
Meanwhile, we’ll discuss the next metric closely related to page responsiveness.
4. Max Potential First Input Delay
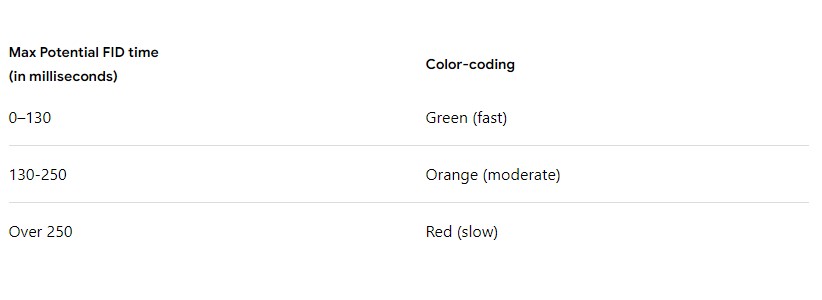
Max Potential First Input Delay measures the worst-case First Input Delay your users might experience. First Input Delay is the Core Web Vitals metric that evaluates the responsiveness of a webpage. To be more specific, First Input Delay measures the time from when a user first interacts with your site (for example, by clicking a button) to the time when a browser is able to respond to that interaction.
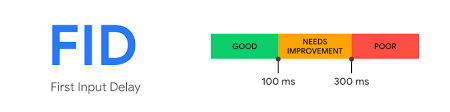
To provide a good user experience, you should strive to make your Max Potential First Input Delay no longer than 130 milliseconds.
Why Max Potential First Input Delay is important
As you already know, First Input Delay is one of the Core Web Vitals metrics. Pretty soon, Google will be using them to rank websites. Given that Max Potential First Input Delay is strongly associated with First Input Delay, we can assume that the Max Potential First Input Delay is equally important.
And we can understand why: users hate waiting too long for responses to their input. If a page’s main content is loaded but not interactive for a while, users may leave that page and assume that it’s broken. So make sure Max Potential First Input Delay on your pages is low enough to provide a good user experience.
After that, move on to the next parameter.
Estimated Input Latency is an estimate of how long your app takes to respond to user input during the busiest five-second window of page load. Ideally, it should respond within 50 milliseconds.
Why Estimated Input Latency is important
If your app’s Estimated Input Latency is longer than 50 milliseconds, users may perceive your app as laggy. If the app doesn’t respond to user input fast enough, users may lose their patience and visit another website in SERP. As a result, you will lose potential customers or blog readers.
Now, as you’ve learned what metrics mean and why they’re important, you are probably wondering how to improve your website’s score for them. That’s exactly what we’re about to discuss.
How to improve Lighthouse Performance score
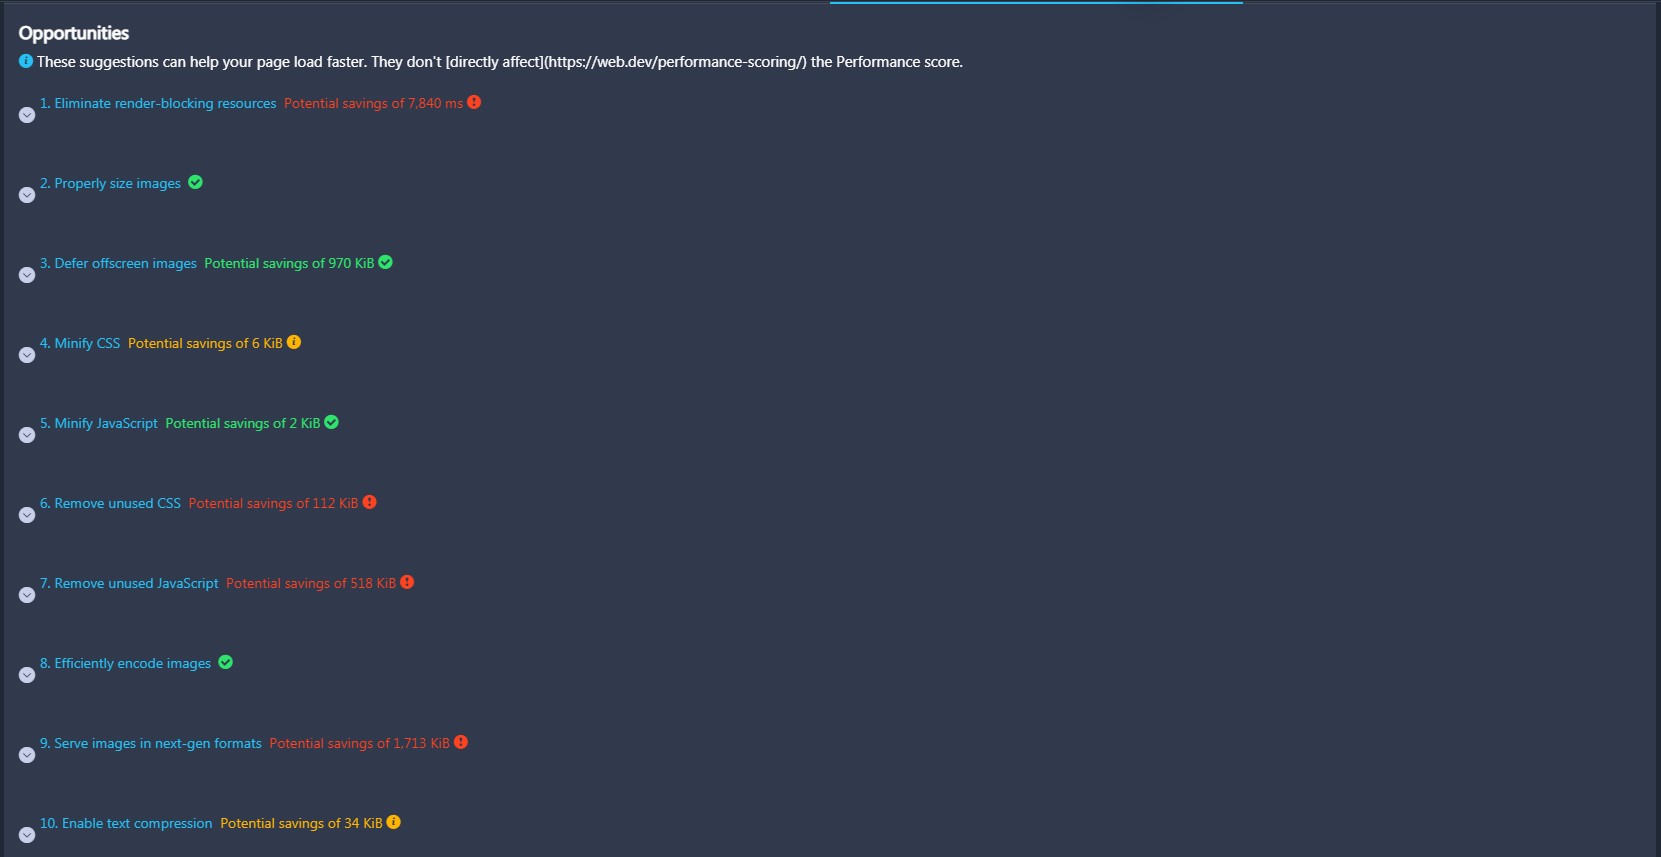
If one of your website pages has a low Performance score, you can try to improve it by following Google’s recommendations. Luckily, you can find them inside the Lighthouse tool. Just visit the Opportunities section and see what can be done to improve the score. There you’ll find 17 suggestions.
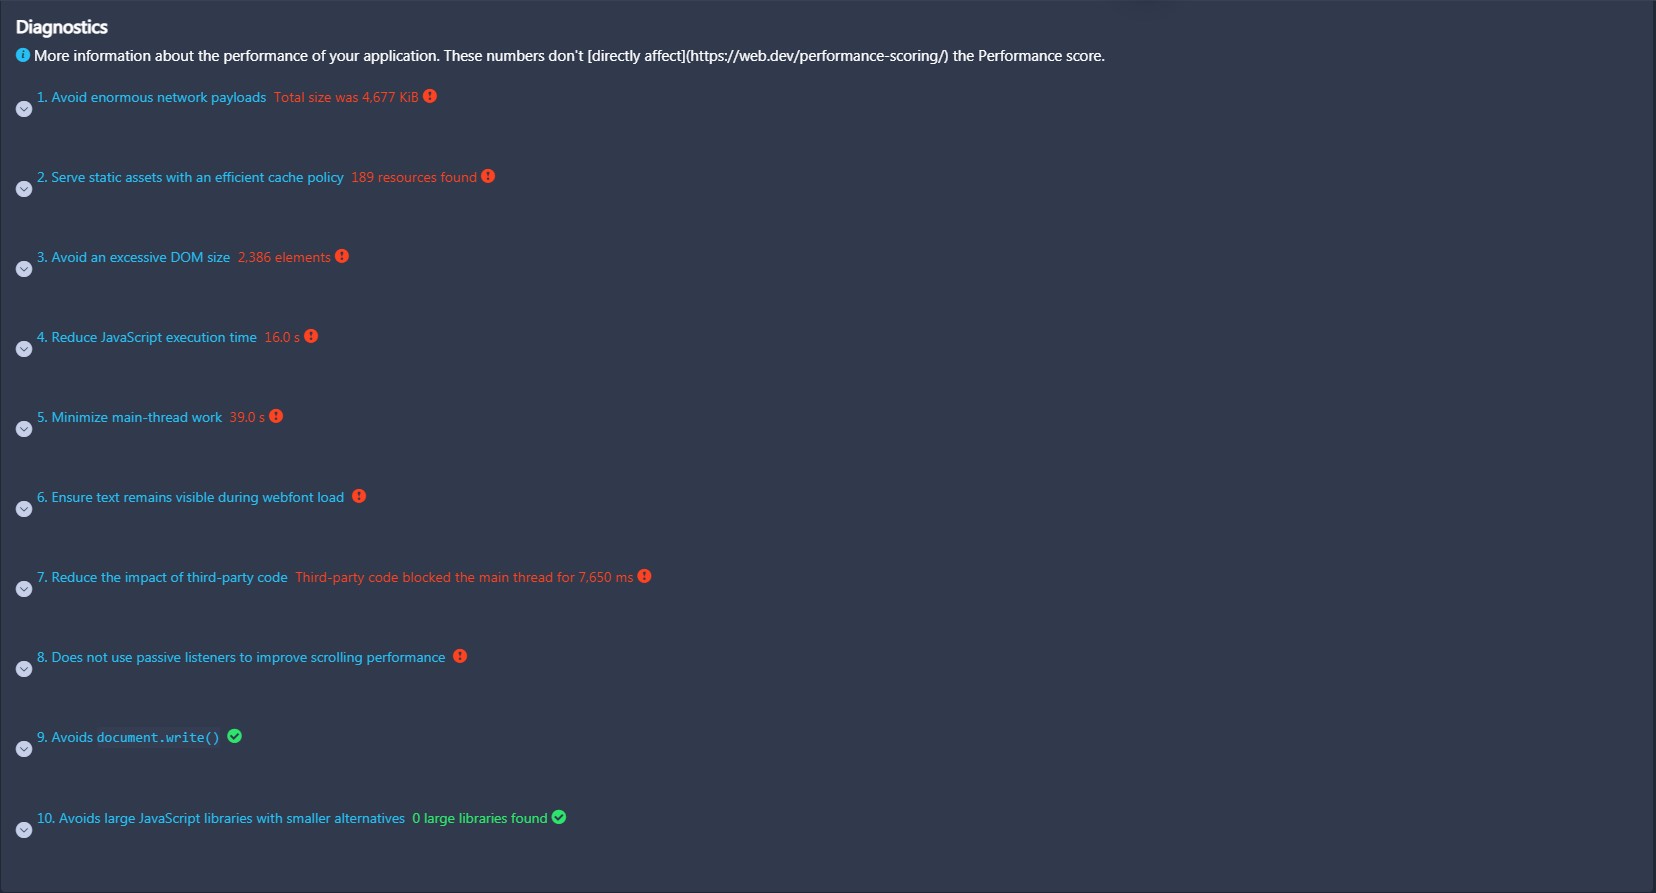
After that, visit the Diagnostics section to find ten more recommendations.
Implement those suggestions and rescan your webpage to make sure the score has improved. Even though some of them don’t impact the Performance score directly, they can definitely help you improve the user experience on your pages. We will explain all these improvement tips in the following articles so make sure to visit our blog regularly so that you won’t miss any important information.
Conclusion
We hope after reading this, you won’t underestimate user experience on a page.
According to Google, page experience signals will be included in search ranking in May 2021. That means you have only three months to prepare for the future update.
So why are you still here?
Go run a performance test in Lighthouse and make sure your webpages get the highest scores possible.
Sign up to RankActive and use our version of Lighthouse along with other advanced SEO tools for 14 days for free. By creating an account, you will gain access to six optimization instruments that will make your working routine much faster, easier, and productive.
Tags: Google Lighthouse, Lighthouse, Lighthouse Metrics, RankActive
Like this article? There’s more where that came from.
- 5 Questions to Ask Yourself Before Paying for Rank Tracking Software
- 5 Serious Mistakes Beginner SEOs Make and How to Fix Them
- Why We Use Google’s New Link Attributes and You Should Too
- Title and Description in 2021: Why Google Rewrites SEOs’ Meta Tags
- What We Should Learn From Google’s “About This Result” Feature